
- Start >
- Rivers >
- Discharge >
- Unterer Main >
- Hafenlohr >
- Chart of year

Chart of year Hafenlohr / Hafenlohr
Discharge from 18.01.2020 to 17.01.2021
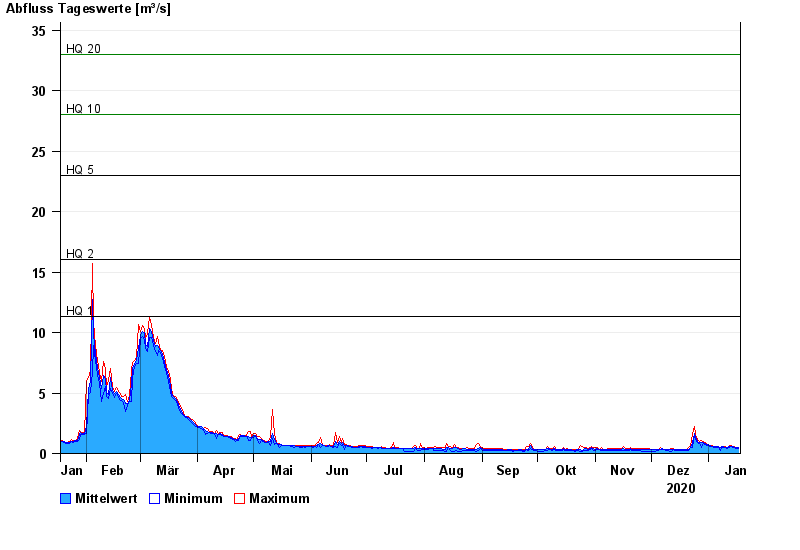
- HQ1 11,3 m³/s
- HQ2 16 m³/s
- HQ5 23 m³/s
- HQ10 28 m³/s
- HQ20 33 m³/s
- HQ50 40 m³/s
- HQ100 45 m³/s
| Date | Mean value [m³/s] | Maximum [m³/s] | Minimum [m³/s] |
|---|---|---|---|
| 17.01.2021 | 0.423 | 0.455 | 0.061 |
| 16.01.2021 | 0.436 | 0.455 | 0.01 |
| 15.01.2021 | 0.457 | 0.504 | 0.019 |
| 14.01.2021 | 0.503 | 0.504 | 0.455 |
| 13.01.2021 | 0.563 | 0.61 | 0.504 |
| 12.01.2021 | 0.519 | 0.61 | 0.455 |
| 11.01.2021 | 0.451 | 0.455 | 0.409 |
© Bayerisches Landesamt für Umwelt 2024