
- Start >
- Rivers >
- Discharge >
- Unterer Main >
- Bürgstadt >
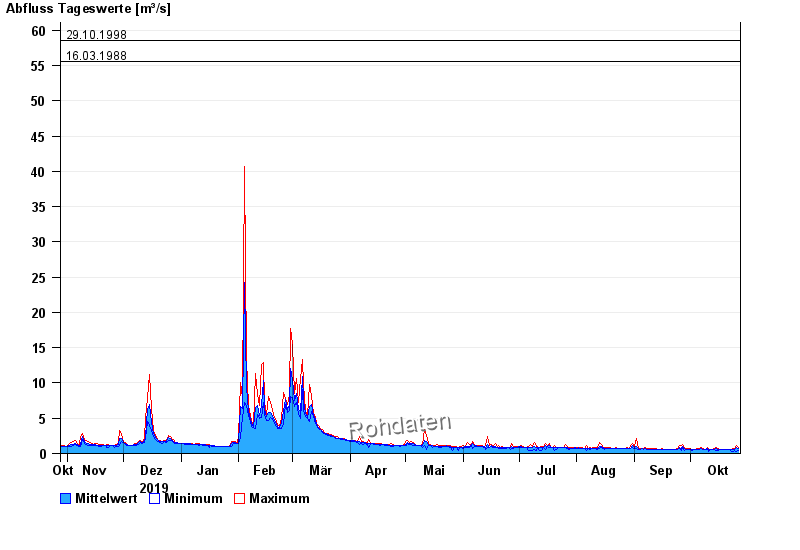
- Chart of year

Chart of year Bürgstadt / Erf
Discharge from 28.10.2019 to 27.10.2020
- 23.05.1978 Abfluss: 84,1 m³/s
- 26.01.1995 Abfluss: 65,2 m³/s
- 31.12.1993 Abfluss: 64,6 m³/s
- 29.10.1998 Abfluss: 58,5 m³/s
- 16.03.1988 Abfluss: 55,5 m³/s
| Date | Mean value [m³/s] | Maximum [m³/s] | Minimum [m³/s] |
|---|---|---|---|
| 27.10.2020 | 0.691 | 0.879 | 0.437 |
| 26.10.2020 | 0.785 | 1.16 | 0.324 |
| 25.10.2020 | 0.526 | 0.568 | 0.437 |
| 24.10.2020 | 0.55 | 0.64 | 0.226 |
| 23.10.2020 | 0.537 | 0.568 | 0.226 |
| 22.10.2020 | 0.516 | 0.568 | 0.5 |
| 21.10.2020 | 0.551 | 0.568 | 0.5 |
© Bayerisches Landesamt für Umwelt 2024