
- Start >
- Rivers >
- Discharge >
- Unterer Main >
- Bürgstadt >
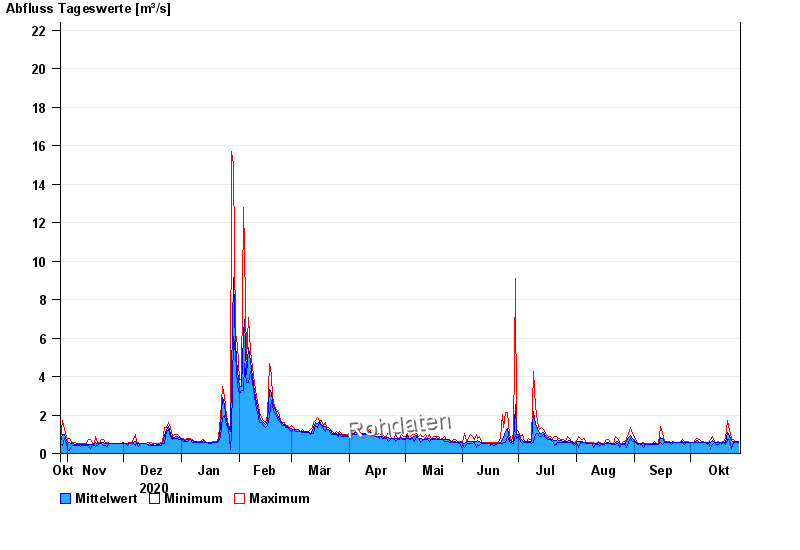
- Chart of year

Chart of year Bürgstadt / Erf
Discharge from 28.10.2020 to 27.10.2021
- 23.05.1978 Abfluss: 84,1 m³/s
- 26.01.1995 Abfluss: 65,2 m³/s
- 31.12.1993 Abfluss: 64,6 m³/s
- 29.10.1998 Abfluss: 58,5 m³/s
- 16.03.1988 Abfluss: 55,5 m³/s
| Date | Mean value [m³/s] | Maximum [m³/s] | Minimum [m³/s] |
|---|---|---|---|
| 27.10.2021 | 0.624 | 0.633 | 0.559 |
| 26.10.2021 | 0.63 | 0.633 | 0.559 |
| 25.10.2021 | 0.616 | 0.633 | 0.559 |
| 24.10.2021 | 0.62 | 0.711 | 0.559 |
| 23.10.2021 | 0.671 | 0.794 | 0.256 |
| 22.10.2021 | 0.934 | 1.17 | 0.711 |
| 21.10.2021 | 1.07 | 1.74 | 0.711 |
© Bayerisches Landesamt für Umwelt 2024