
- Start >
- Rivers >
- Discharge >
- Unterer Main >
- Bruckberg >
- Chart of year

Chart of year Bruckberg / Haselbach
Discharge from 29.03.2024 to 28.03.2025
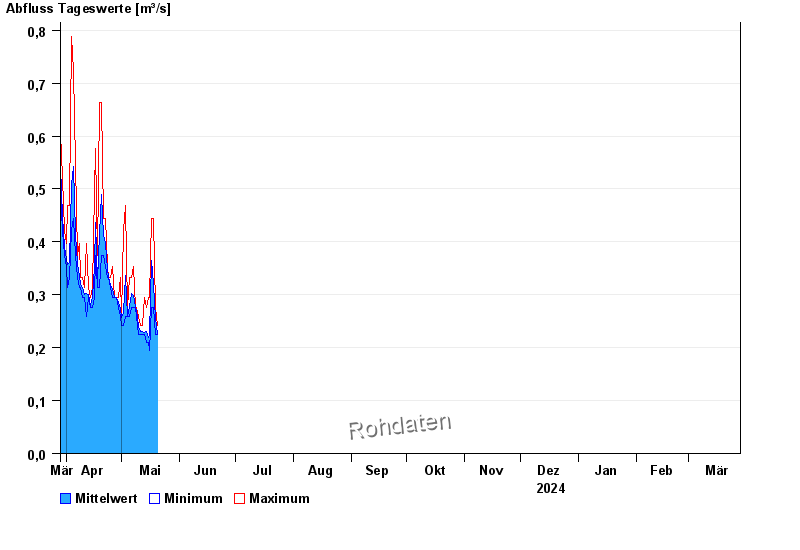
| Date | Mean value [m³/s] | Maximum [m³/s] | Minimum [m³/s] |
|---|---|---|---|
| 10.05.2024 | 0.242 | 0.258 | 0.241 |
| 09.05.2024 | 0.271 | 0.276 | 0.258 |
| 08.05.2024 | 0.276 | 0.276 | 0.276 |
| 07.05.2024 | 0.299 | 0.354 | 0.276 |
| 06.05.2024 | 0.303 | 0.333 | 0.276 |
| 05.05.2024 | 0.278 | 0.333 | 0.258 |
| 04.05.2024 | 0.258 | 0.276 | 0.258 |
© Bayerisches Landesamt für Umwelt 2024