
- Start >
- Rivers >
- Discharge >
- Unterer Main >
- Bruckberg >
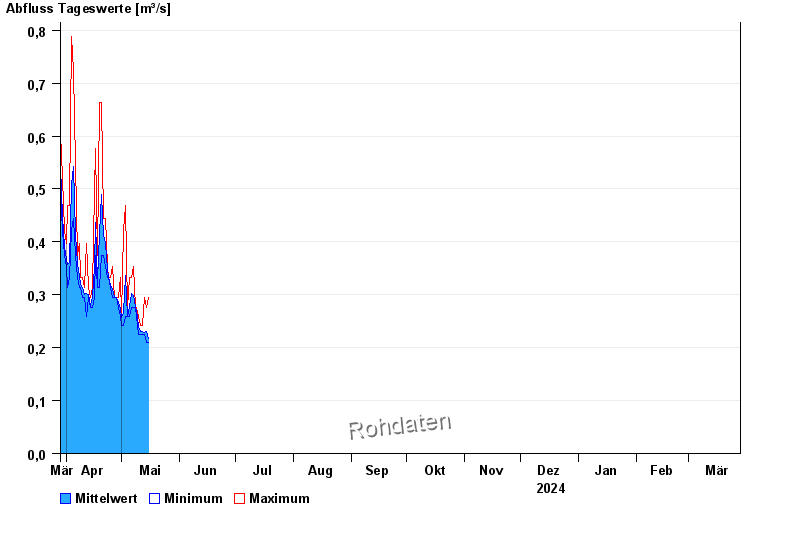
- Chart of year

Chart of year Bruckberg / Haselbach
Discharge from 29.03.2024 to 28.03.2025
- 08.01.2011 Abfluss: 14,3 m³/s
- 22.01.2012 Abfluss: 13,9 m³/s
- 21.12.1993 Abfluss: 12,7 m³/s
- 13.01.2011 Abfluss: 12,1 m³/s
- 13.04.1994 Abfluss: 12 m³/s
| Date | Mean value [m³/s] | Maximum [m³/s] | Minimum [m³/s] |
|---|---|---|---|
| 10.05.2024 | 0.241 | 0.258 | 0.225 |
| 09.05.2024 | 0.271 | 0.276 | 0.258 |
| 08.05.2024 | 0.276 | 0.276 | 0.276 |
| 07.05.2024 | 0.299 | 0.354 | 0.276 |
| 06.05.2024 | 0.303 | 0.333 | 0.276 |
| 05.05.2024 | 0.278 | 0.333 | 0.258 |
| 04.05.2024 | 0.258 | 0.276 | 0.258 |
© Bayerisches Landesamt für Umwelt 2024