
- Start >
- Rivers >
- Discharge >
- Unterer Main >
- Birkenfeld >
- Chart of year

Chart of year Birkenfeld / Aisch
Discharge from 01.01.2022 to 31.12.2022
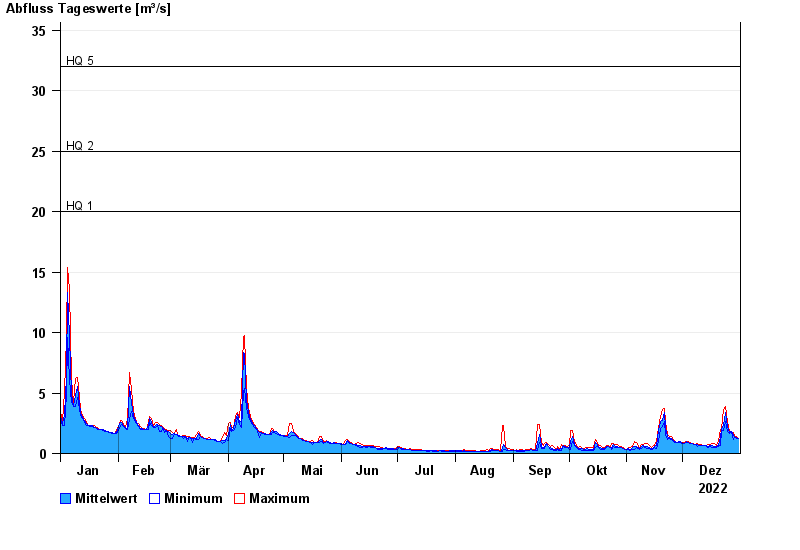
- HQ1 20 m³/s
- HQ2 25 m³/s
- HQ5 32 m³/s
- HQ10 40 m³/s
- HQ20 50 m³/s
- HQ50 65 m³/s
- HQ100 80 m³/s
| Date | Mean value [m³/s] | Maximum [m³/s] | Minimum [m³/s] |
|---|---|---|---|
| 31.12.2022 | 1.25 | 1.27 | 1.22 |
| 30.12.2022 | 1.3 | 1.38 | 1.27 |
| 29.12.2022 | 1.42 | 1.43 | 1.38 |
| 28.12.2022 | 1.52 | 1.77 | 1.17 |
| 27.12.2022 | 1.8 | 1.83 | 1.77 |
| 26.12.2022 | 1.73 | 1.83 | 1.65 |
| 25.12.2022 | 2.21 | 2.64 | 1.83 |
© Bayerisches Landesamt für Umwelt 2024