
- Start >
- Rivers >
- Discharge >
- Unterer Main >
- Birkenfeld >
- Chart of year

Chart of year Birkenfeld / Aisch
Discharge from 01.01.2021 to 31.12.2021
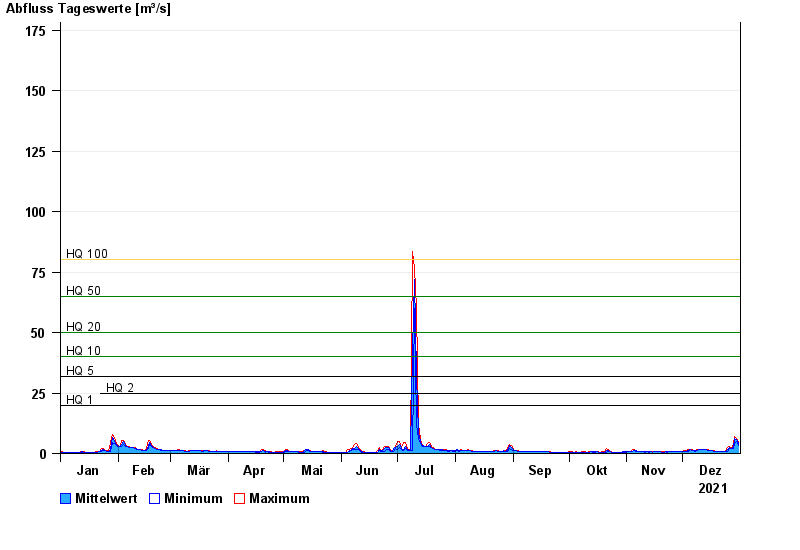
- HQ1 20 m³/s
- HQ2 25 m³/s
- HQ5 32 m³/s
- HQ10 40 m³/s
- HQ20 50 m³/s
- HQ50 65 m³/s
- HQ100 80 m³/s
| Date | Mean value [m³/s] | Maximum [m³/s] | Minimum [m³/s] |
|---|---|---|---|
| 31.12.2021 | 4.17 | 5.09 | 3.51 |
| 30.12.2021 | 5.59 | 6.01 | 5.09 |
| 29.12.2021 | 6.27 | 6.98 | 4.33 |
| 28.12.2021 | 2.45 | 4.33 | 2.07 |
| 27.12.2021 | 2 | 2.07 | 1.89 |
| 26.12.2021 | 2.42 | 2.75 | 2.01 |
| 25.12.2021 | 1.71 | 2.57 | 0.911 |
© Bayerisches Landesamt für Umwelt 2024