
- Start >
- Rivers >
- Discharge >
- Obere Donau >
- Wittislingen >
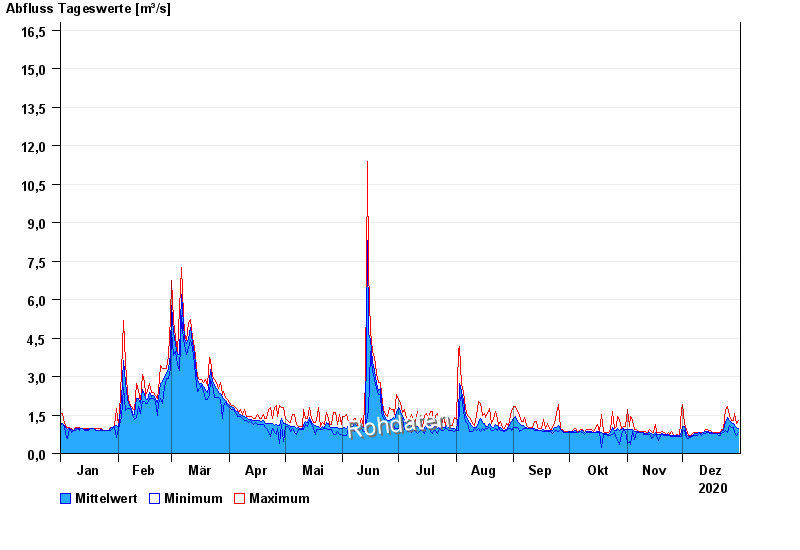
- Chart of year

Chart of year Wittislingen / Egau
Discharge from 01.01.2020 to 31.12.2020
- 14.04.1994 Abfluss: 32,2 m³/s
- 03.03.1956 Abfluss: 27,8 m³/s
- 15.02.1990 Abfluss: 23,6 m³/s
- 06.01.1982 Abfluss: 23,3 m³/s
- 23.03.2002 Abfluss: 21,8 m³/s
| Date | Mean value [m³/s] | Maximum [m³/s] | Minimum [m³/s] |
|---|---|---|---|
| 31.12.2020 | 0.965 | 1.3 | 0.827 |
| 30.12.2020 | 0.998 | 1.15 | 0.718 |
| 29.12.2020 | 1.09 | 1.55 | 0.827 |
| 28.12.2020 | 1.15 | 1.3 | 1.01 |
| 27.12.2020 | 1.19 | 1.3 | 1.01 |
| 26.12.2020 | 1.29 | 1.47 | 1.08 |
| 25.12.2020 | 1.39 | 1.83 | 0.827 |
© Bayerisches Landesamt für Umwelt 2024