
- Start >
- Rivers >
- Discharge >
- Obere Donau >
- Wittislingen >
- Chart of year

Chart of year Wittislingen / Egau
Discharge from 01.01.2020 to 31.12.2020
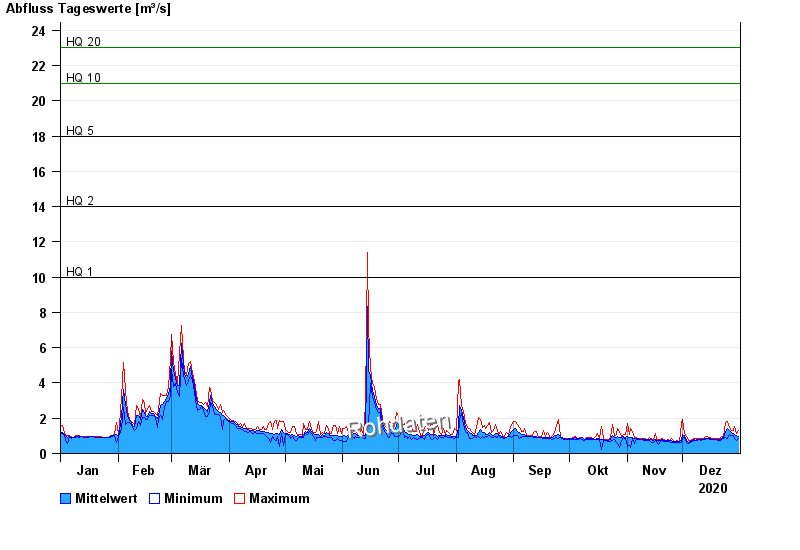
- HQ1 10 m³/s
- HQ2 14 m³/s
- HQ5 18 m³/s
- HQ10 21 m³/s
- HQ20 23 m³/s
- HQ50 26 m³/s
- HQ100 28 m³/s
| Date | Mean value [m³/s] | Maximum [m³/s] | Minimum [m³/s] |
|---|---|---|---|
| 31.12.2020 | 0.965 | 1.3 | 0.827 |
| 30.12.2020 | 0.998 | 1.15 | 0.718 |
| 29.12.2020 | 1.09 | 1.55 | 0.827 |
| 28.12.2020 | 1.15 | 1.3 | 1.01 |
| 27.12.2020 | 1.19 | 1.3 | 1.01 |
| 26.12.2020 | 1.29 | 1.47 | 1.08 |
| 25.12.2020 | 1.39 | 1.83 | 0.827 |
© Bayerisches Landesamt für Umwelt 2024