
- Start >
- Rivers >
- Discharge >
- Obere Donau >
- Treuchtlingen >
- Chart of total period

Chart of total period Treuchtlingen / Altmühl
Discharge from 01.11.1929 to 26.04.2024
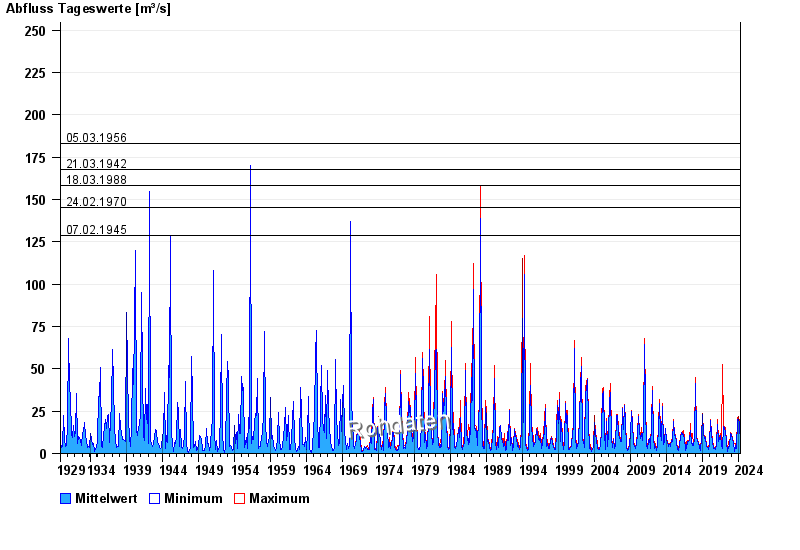
- 05.03.1956 Abfluss: 183 m³/s
- 21.03.1942 Abfluss: 168 m³/s
- 18.03.1988 Abfluss: 158 m³/s
- 24.02.1970 Abfluss: 145 m³/s
- 07.02.1945 Abfluss: 129 m³/s
| Date | Mean value [m³/s] | Maximum [m³/s] | Minimum [m³/s] |
|---|---|---|---|
| 26.04.2024 | 4.22 | 4.4 | 4.21 |
| 25.04.2024 | 4.4 | 4.4 | 4.21 |
| 24.04.2024 | 4.34 | 4.4 | 4.21 |
| 23.04.2024 | 4.21 | 4.21 | 4.21 |
| 22.04.2024 | 4.15 | 4.21 | 4.01 |
| 21.04.2024 | 3.96 | 4.01 | 3.81 |
| 20.04.2024 | 3.87 | 4.01 | 3.81 |
© Bayerisches Landesamt für Umwelt 2024