
- Start >
- Rivers >
- Waterlevel >
- Obere Donau >
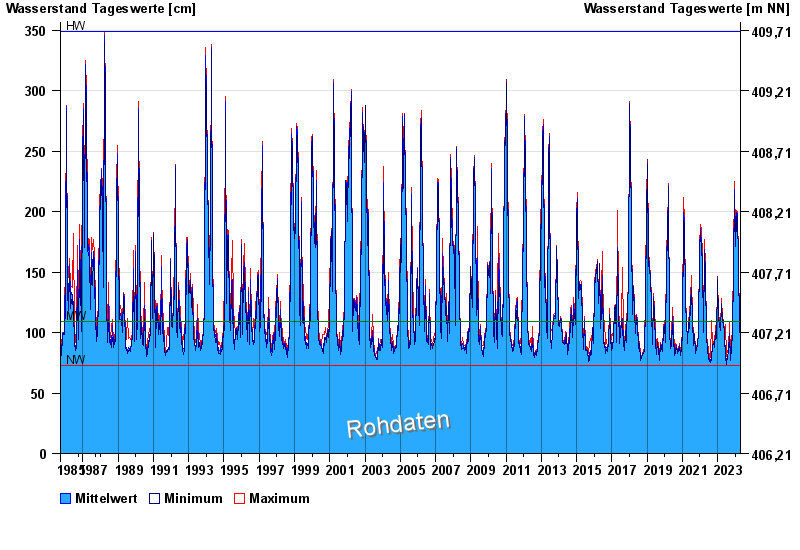
- Treuchtlingen >
- Chart of total period

Chart of total period Treuchtlingen / Altmühl
Waterlevel from 23.09.1985 to 19.04.2024
| Date | Mean value [cm] | Maximum [cm] | Minimum [cm] |
|---|---|---|---|
| 19.04.2024 | 91 | 91 | 91 |
| 18.04.2024 | 90 | 92 | 88 |
| 17.04.2024 | 90 | 90 | 90 |
| 16.04.2024 | 90 | 90 | 89 |
| 15.04.2024 | 89 | 90 | 88 |
| 14.04.2024 | 90 | 90 | 89 |
| 13.04.2024 | 91 | 91 | 89 |
© Bayerisches Landesamt für Umwelt 2024