
- Start >
- Rivers >
- Discharge >
- Obere Donau >
- Reichenbach >
- Chart of year

Chart of year Reichenbach / Wörnitz
Discharge from 01.12.2023 to 30.11.2024
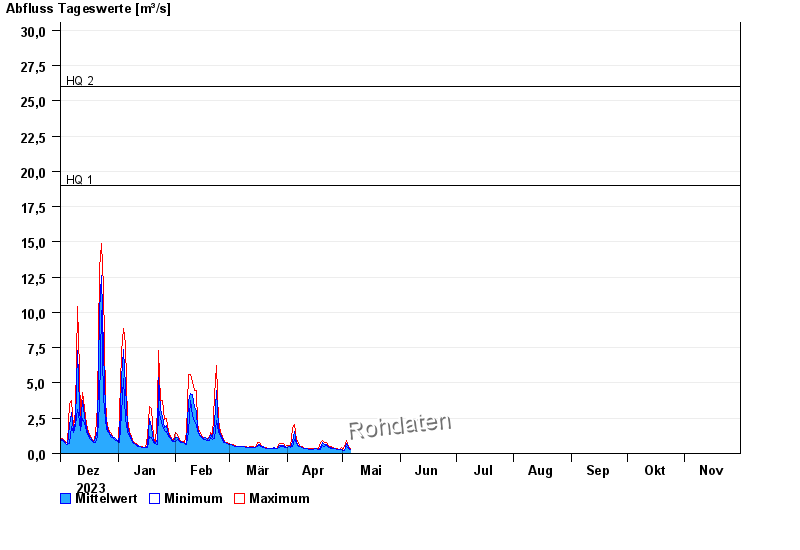
- HQ1 19 m³/s
- HQ2 26 m³/s
- HQ5 36 m³/s
- HQ10 43 m³/s
- HQ20 50 m³/s
- HQ50 60 m³/s
- HQ100 68 m³/s
| Date | Mean value [m³/s] | Maximum [m³/s] | Minimum [m³/s] |
|---|---|---|---|
| 01.09.2024 | 0.06 | 0.06 | 0.06 |
| 31.08.2024 | 0.057 | 0.071 | 0.05 |
| 30.08.2024 | 0.054 | 0.06 | 0.05 |
| 29.08.2024 | 0.073 | 0.216 | 0.06 |
| 28.08.2024 | 0.06 | 0.06 | 0.06 |
| 27.08.2024 | 0.066 | 0.071 | 0.06 |
| 26.08.2024 | 0.065 | 0.071 | 0.06 |
© Bayerisches Landesamt für Umwelt 2024