
- Start >
- Rivers >
- Discharge >
- Obere Donau >
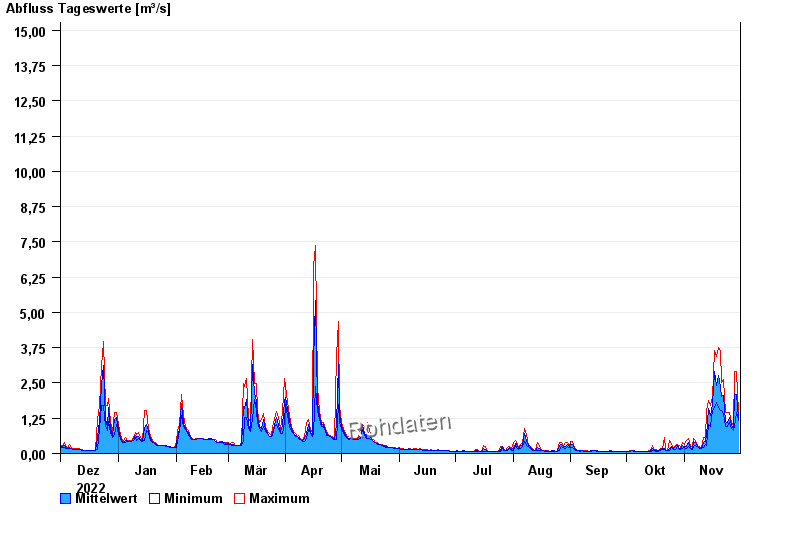
- Reichenbach >
- Chart of year

Chart of year Reichenbach / Wörnitz
Discharge from 01.12.2022 to 30.11.2023
- HQ1 19 m³/s
- HQ2 26 m³/s
- HQ5 36 m³/s
- HQ10 43 m³/s
- HQ20 50 m³/s
- HQ50 60 m³/s
- HQ100 68 m³/s
| Date | Mean value [m³/s] | Maximum [m³/s] | Minimum [m³/s] |
|---|---|---|---|
| 30.11.2023 | 1.25 | 1.46 | 1.16 |
| 29.11.2023 | 2.1 | 2.9 | 1.46 |
| 28.11.2023 | 2.12 | 2.9 | 0.945 |
| 27.11.2023 | 0.858 | 0.945 | 0.813 |
| 26.11.2023 | 1.02 | 1.09 | 0.876 |
| 25.11.2023 | 1.27 | 1.46 | 1.09 |
| 24.11.2023 | 1.11 | 1.46 | 0.945 |
© Bayerisches Landesamt für Umwelt 2024