
- Start >
- Rivers >
- Discharge >
- Obere Donau >
- Parsberg >
- Chart of year

Chart of year Parsberg / Schwarze Laber
Discharge from 01.01.2016 to 31.12.2016
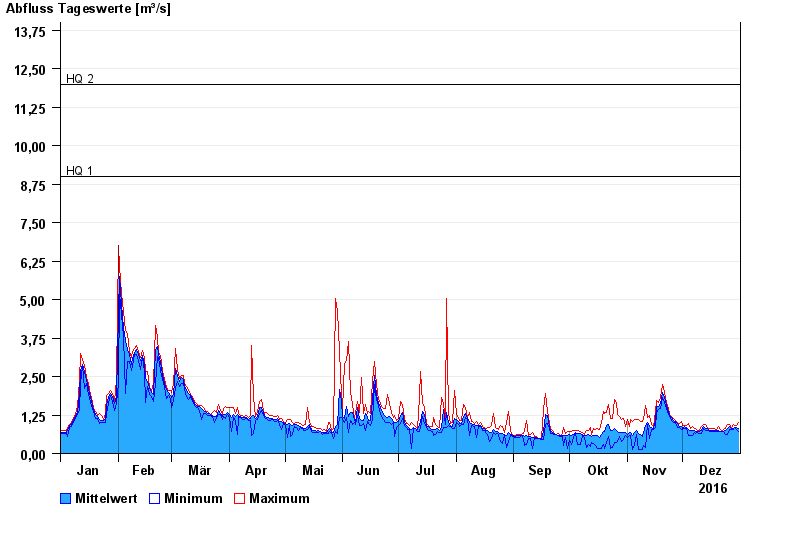
- HQ1 9 m³/s
- HQ2 12 m³/s
- HQ5 15,5 m³/s
- HQ10 19 m³/s
- HQ20 25 m³/s
- HQ50 36 m³/s
- HQ100 50 m³/s
| Date | Mean value [m³/s] | Maximum [m³/s] | Minimum [m³/s] |
|---|---|---|---|
| 31.12.2016 | 0.827 | 1.02 | 0.72 |
| 30.12.2016 | 0.831 | 0.897 | 0.777 |
| 29.12.2016 | 0.836 | 0.895 | 0.834 |
| 28.12.2016 | 0.826 | 0.954 | 0.774 |
| 27.12.2016 | 0.82 | 0.833 | 0.773 |
| 26.12.2016 | 0.861 | 0.951 | 0.772 |
| 25.12.2016 | 0.809 | 0.949 | 0.608 |
© Bayerisches Landesamt für Umwelt 2024