
- Start >
- Rivers >
- Discharge >
- Obere Donau >
- Parsberg >
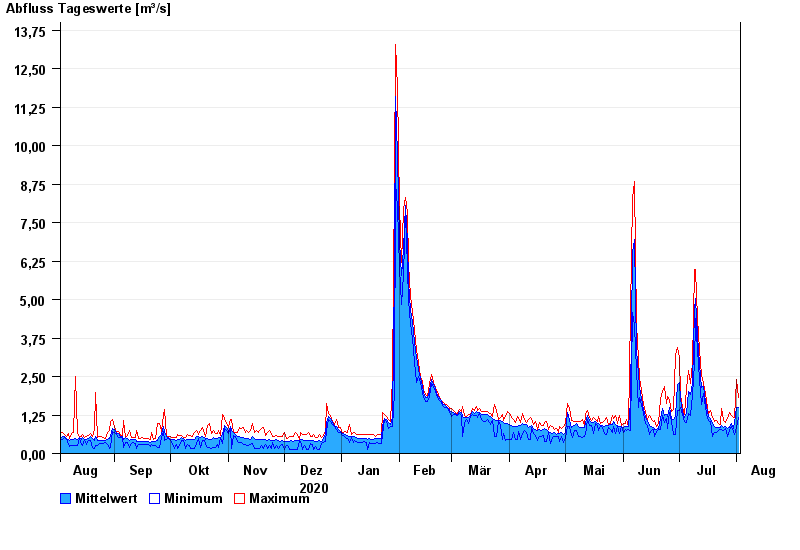
- Chart of year

Chart of year Parsberg / Schwarze Laber
Discharge from 03.08.2020 to 02.08.2021
| Date | Mean value [m³/s] | Maximum [m³/s] | Minimum [m³/s] |
|---|---|---|---|
| 02.08.2021 | 1.5 | 1.82 | 1.18 |
| 01.08.2021 | 1.51 | 2.4 | 0.832 |
| 31.07.2021 | 1.01 | 1.17 | 0.631 |
| 30.07.2021 | 0.825 | 1.17 | 0.719 |
| 29.07.2021 | 0.96 | 1.24 | 0.874 |
| 28.07.2021 | 0.856 | 1.33 | 0.758 |
| 27.07.2021 | 0.812 | 1.15 | 0.536 |
© Bayerisches Landesamt für Umwelt 2024