
- Start >
- Rivers >
- Discharge >
- Obere Donau >
- Parsberg >
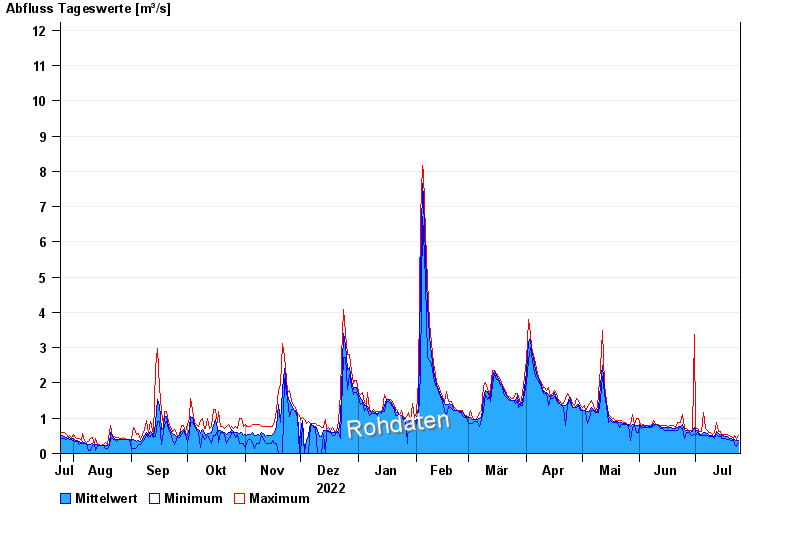
- Chart of year

Chart of year Parsberg / Schwarze Laber
Discharge from 25.07.2022 to 24.07.2023
- 14.01.2011 Abfluss: 30,4 m³/s
- 23.02.1970 Abfluss: 27,3 m³/s
- 13.02.2005 Abfluss: 20,5 m³/s
- 21.12.1993 Abfluss: 20,3 m³/s
- 03.03.1987 Abfluss: 19,7 m³/s
| Date | Mean value [m³/s] | Maximum [m³/s] | Minimum [m³/s] |
|---|---|---|---|
| 24.07.2023 | 0.381 | 0.509 | 0.315 |
| 23.07.2023 | 0.355 | 0.401 | 0.203 |
| 22.07.2023 | 0.388 | 0.509 | 0.243 |
| 21.07.2023 | 0.404 | 0.438 | 0.371 |
| 20.07.2023 | 0.419 | 0.472 | 0.371 |
| 19.07.2023 | 0.438 | 0.509 | 0.401 |
| 18.07.2023 | 0.468 | 0.544 | 0.401 |
© Bayerisches Landesamt für Umwelt 2024