
- Start >
- Rivers >
- Discharge >
- Obere Donau >
- Parsberg >
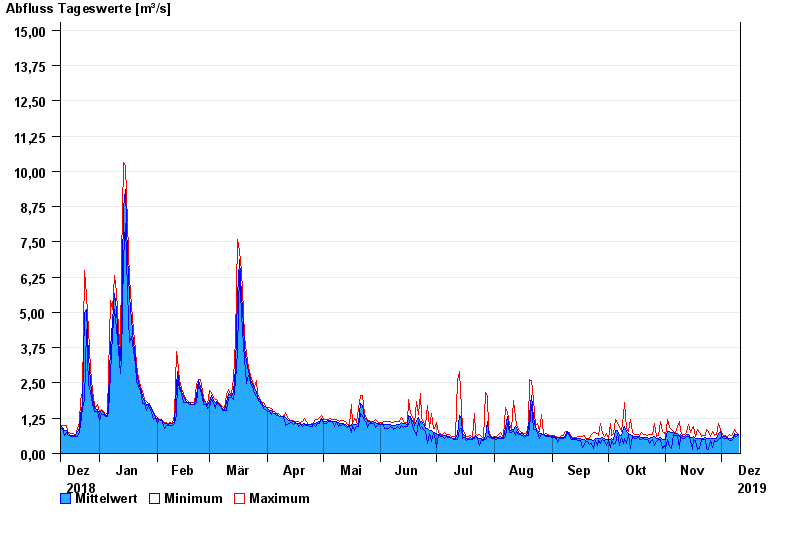
- Chart of year

Chart of year Parsberg / Schwarze Laber
Discharge from 11.12.2018 to 10.12.2019
- 14.01.2011 Abfluss: 30,4 m³/s
- 23.02.1970 Abfluss: 27,3 m³/s
- 13.02.2005 Abfluss: 20,5 m³/s
- 21.12.1993 Abfluss: 20,3 m³/s
- 03.03.1987 Abfluss: 19,7 m³/s
| Date | Mean value [m³/s] | Maximum [m³/s] | Minimum [m³/s] |
|---|---|---|---|
| 10.12.2019 | 0.662 | 0.69 | 0.638 |
| 09.12.2019 | 0.656 | 0.743 | 0.589 |
| 08.12.2019 | 0.704 | 0.851 | 0.638 |
| 07.12.2019 | 0.617 | 0.743 | 0.544 |
| 06.12.2019 | 0.542 | 0.638 | 0.461 |
| 05.12.2019 | 0.534 | 0.69 | 0.461 |
| 04.12.2019 | 0.566 | 0.589 | 0.544 |
© Bayerisches Landesamt für Umwelt 2024