
- Start >
- Rivers >
- Discharge >
- Obere Donau >
- Parsberg >
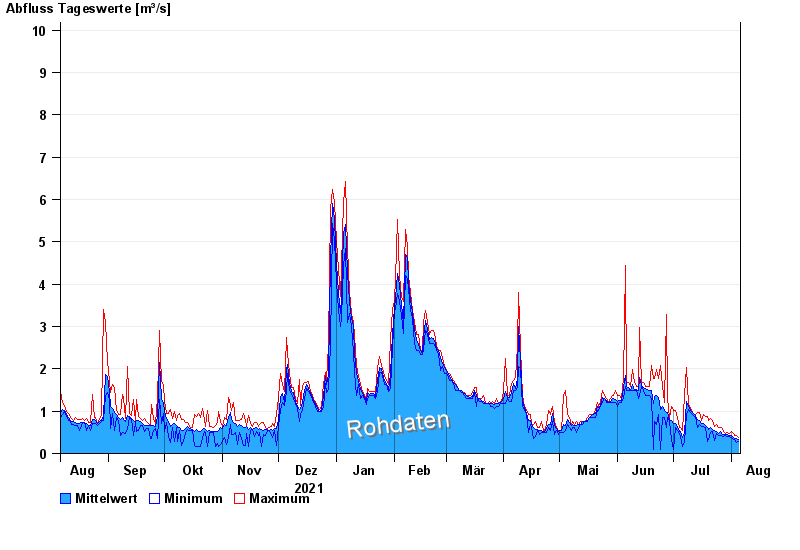
- Chart of year

Chart of year Parsberg / Schwarze Laber
Discharge from 06.08.2021 to 05.08.2022
- 14.01.2011 Abfluss: 30,4 m³/s
- 23.02.1970 Abfluss: 27,3 m³/s
- 13.02.2005 Abfluss: 20,5 m³/s
- 21.12.1993 Abfluss: 20,3 m³/s
- 03.03.1987 Abfluss: 19,7 m³/s
| Date | Mean value [m³/s] | Maximum [m³/s] | Minimum [m³/s] |
|---|---|---|---|
| 05.08.2022 | 0.323 | 0.372 | 0.289 |
| 04.08.2022 | 0.343 | 0.434 | 0.266 |
| 03.08.2022 | 0.357 | 0.434 | 0.34 |
| 02.08.2022 | 0.374 | 0.464 | 0.34 |
| 01.08.2022 | 0.415 | 0.531 | 0.372 |
| 31.07.2022 | 0.436 | 0.464 | 0.401 |
| 30.07.2022 | 0.453 | 0.499 | 0.401 |
© Bayerisches Landesamt für Umwelt 2024