
- Start >
- Rivers >
- Discharge >
- Obere Donau >
- Parsberg >
- Chart of year

Chart of year Parsberg / Schwarze Laber
Discharge from 29.07.2022 to 28.07.2023
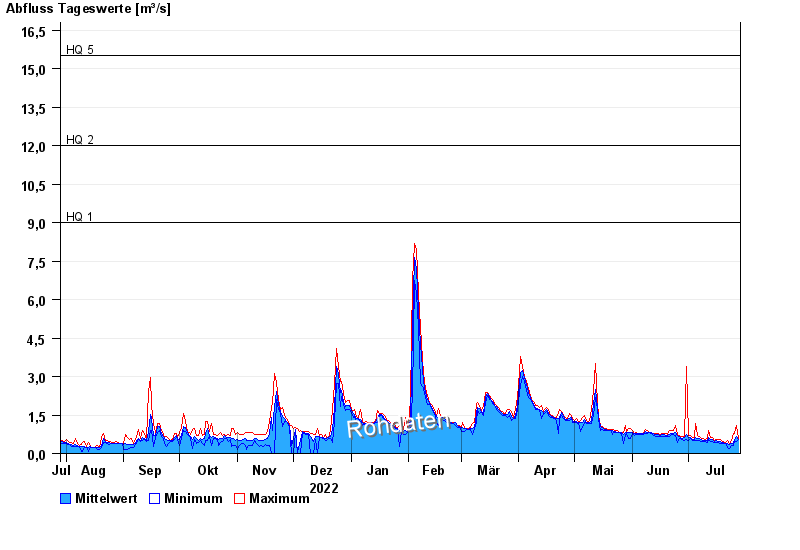
- HQ1 9 m³/s
- HQ2 12 m³/s
- HQ5 15,5 m³/s
- HQ10 19 m³/s
- HQ20 25 m³/s
- HQ50 36 m³/s
- HQ100 50 m³/s
| Date | Mean value [m³/s] | Maximum [m³/s] | Minimum [m³/s] |
|---|---|---|---|
| 28.07.2023 | 0.558 | 0.584 | 0.544 |
| 27.07.2023 | 0.653 | 1.1 | 0.472 |
| 26.07.2023 | 0.555 | 0.789 | 0.472 |
| 25.07.2023 | 0.4 | 0.789 | 0.315 |
| 24.07.2023 | 0.381 | 0.509 | 0.315 |
| 23.07.2023 | 0.355 | 0.401 | 0.203 |
| 22.07.2023 | 0.388 | 0.509 | 0.243 |
© Bayerisches Landesamt für Umwelt 2024