
- Start >
- Rivers >
- Discharge >
- Obere Donau >
- Parsberg >
- Chart of year

Chart of year Parsberg / Schwarze Laber
Discharge from 29.07.2020 to 28.07.2021
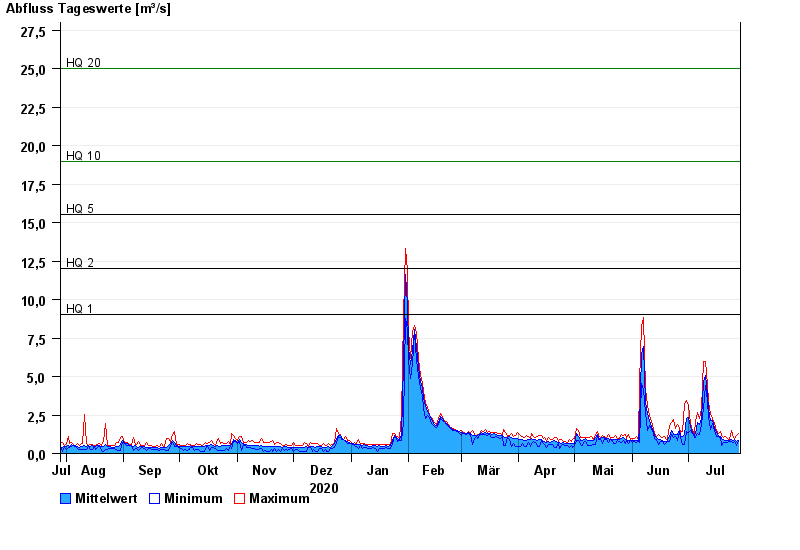
- HQ1 9 m³/s
- HQ2 12 m³/s
- HQ5 15,5 m³/s
- HQ10 19 m³/s
- HQ20 25 m³/s
- HQ50 36 m³/s
- HQ100 50 m³/s
| Date | Mean value [m³/s] | Maximum [m³/s] | Minimum [m³/s] |
|---|---|---|---|
| 28.07.2021 | 0.856 | 1.33 | 0.758 |
| 27.07.2021 | 0.812 | 1.15 | 0.536 |
| 26.07.2021 | 0.888 | 0.991 | 0.802 |
| 25.07.2021 | 0.858 | 1.06 | 0.737 |
| 24.07.2021 | 0.899 | 1.47 | 0.788 |
| 23.07.2021 | 0.84 | 0.932 | 0.784 |
| 22.07.2021 | 0.842 | 0.964 | 0.746 |
© Bayerisches Landesamt für Umwelt 2024