
- Start >
- Rivers >
- Discharge >
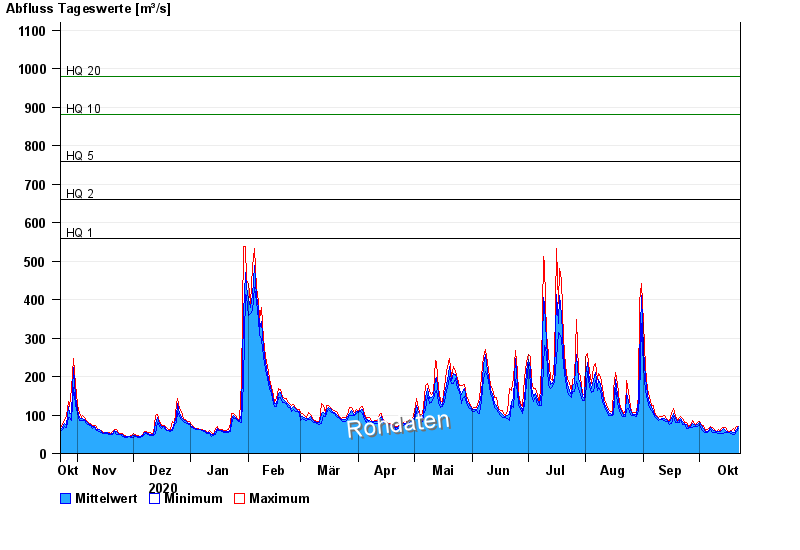
- Obere Donau >
- Neu Ulm, Bad Held >
- Chart of year

Chart of year Neu Ulm, Bad Held / Donau
Discharge from 23.10.2020 to 22.10.2021
ACHTUNG!
Pegel durch außerordentlichen Kraftwerksbetrieb beeinflusst.
- HQ1 560 m³/s
- HQ2 660 m³/s
- HQ5 760 m³/s
- HQ10 880 m³/s
- HQ20 980 m³/s
- HQ50 1110 m³/s
- HQ100 1250 m³/s
| Date | Mean value [m³/s] | Maximum [m³/s] | Minimum [m³/s] |
|---|---|---|---|
| 22.10.2021 | 68.9 | 71.4 | 65.5 |
| 21.10.2021 | 63.4 | 71.4 | 57.1 |
| 20.10.2021 | 53.6 | 59.7 | 49.6 |
| 19.10.2021 | 54.4 | 66.2 | 48.7 |
| 18.10.2021 | 55.9 | 59.7 | 52.5 |
| 17.10.2021 | 55.8 | 57.1 | 53.5 |
| 16.10.2021 | 56.7 | 58 | 55.3 |
© Bayerisches Landesamt für Umwelt 2024