
- Start >
- Rivers >
- Discharge >
- Obere Donau >
- Neu Ulm, Bad Held >
- Chart of year

Chart of year Neu Ulm, Bad Held / Donau
Discharge from 23.10.2021 to 22.10.2022
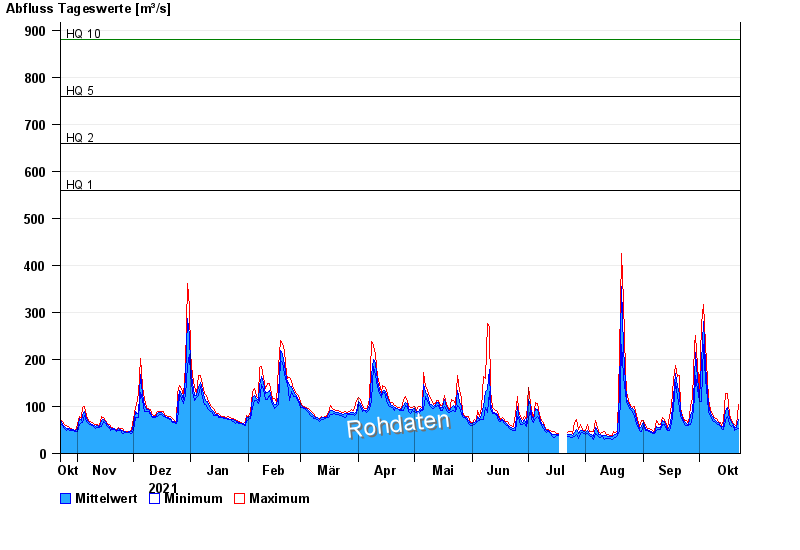
ACHTUNG!
Pegel durch außerordentlichen Kraftwerksbetrieb beeinflusst.
- HQ1 560 m³/s
- HQ2 660 m³/s
- HQ5 760 m³/s
- HQ10 880 m³/s
- HQ20 980 m³/s
- HQ50 1110 m³/s
- HQ100 1250 m³/s
| Date | Mean value [m³/s] | Maximum [m³/s] | Minimum [m³/s] |
|---|---|---|---|
| 22.10.2022 | 72.3 | 105 | 54.1 |
| 21.10.2022 | 55.2 | 59 | 51.7 |
| 20.10.2022 | 56 | 61.5 | 49.4 |
| 19.10.2022 | 60.6 | 64.1 | 59 |
| 18.10.2022 | 65 | 70.7 | 56.5 |
| 17.10.2022 | 74 | 82.1 | 61.5 |
| 16.10.2022 | 97.4 | 128 | 79 |
© Bayerisches Landesamt für Umwelt 2024