
- Start >
- Rivers >
- Discharge >
- Obere Donau >
- Mettendorf >
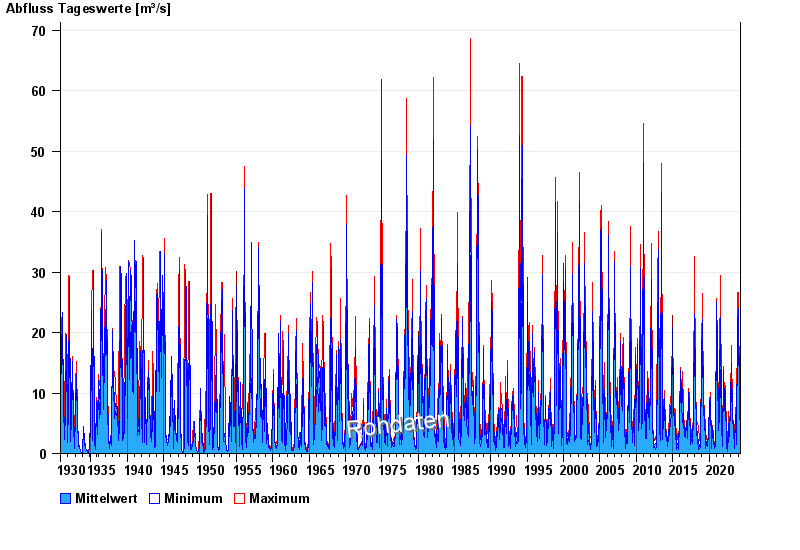
- Chart of total period

Chart of total period Mettendorf / Schwarzach
Discharge from 01.11.1930 to 26.04.2024
| Date | Mean value [m³/s] | Maximum [m³/s] | Minimum [m³/s] |
|---|---|---|---|
| 26.04.2024 | 1.37 | 1.42 | 1.35 |
| 25.04.2024 | 1.46 | 1.56 | 1.42 |
| 24.04.2024 | 1.78 | 2.09 | 1.56 |
| 23.04.2024 | 2.52 | 2.67 | 2.17 |
| 22.04.2024 | 2.63 | 2.67 | 2.59 |
| 21.04.2024 | 2.35 | 2.59 | 2.09 |
| 20.04.2024 | 1.73 | 2.09 | 1.42 |
© Bayerisches Landesamt für Umwelt 2024