
- Start >
- Rivers >
- Discharge >
- Obere Donau >
- Mettendorf >
- Chart of total period

Chart of total period Mettendorf / Schwarzach
Discharge from 01.11.1930 to 18.04.2024
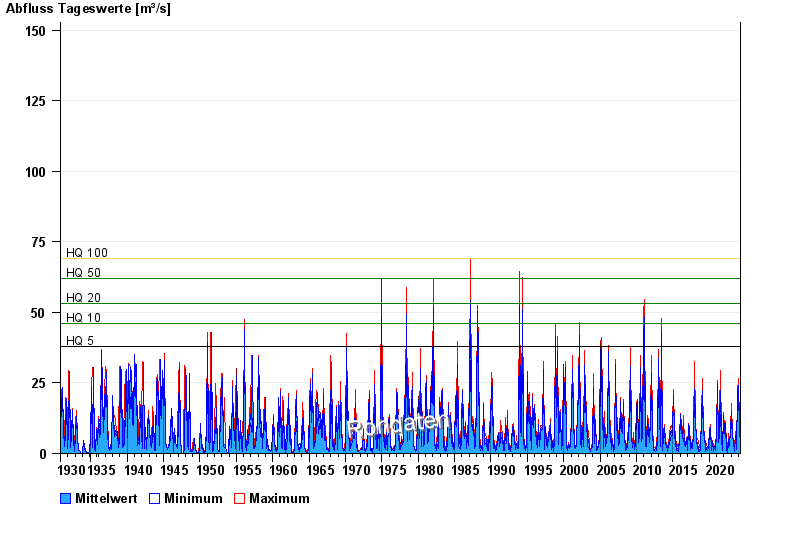
- HQ5 38 m³/s
- HQ10 46 m³/s
- HQ20 53 m³/s
- HQ50 62 m³/s
- HQ100 69 m³/s
| Date | Mean value [m³/s] | Maximum [m³/s] | Minimum [m³/s] |
|---|---|---|---|
| 18.04.2024 | 1.28 | 1.28 | 1.28 |
| 17.04.2024 | 1.32 | 1.42 | 1.22 |
| 16.04.2024 | 0.975 | 1.42 | 0.918 |
| 15.04.2024 | 0.862 | 0.918 | 0.808 |
| 14.04.2024 | 0.841 | 0.863 | 0.808 |
| 13.04.2024 | 0.863 | 0.863 | 0.863 |
| 12.04.2024 | 0.869 | 0.918 | 0.662 |
© Bayerisches Landesamt für Umwelt 2024