
- Start >
- Rivers >
- Discharge >
- Obere Donau >
- Inkofen >
- Chart of year

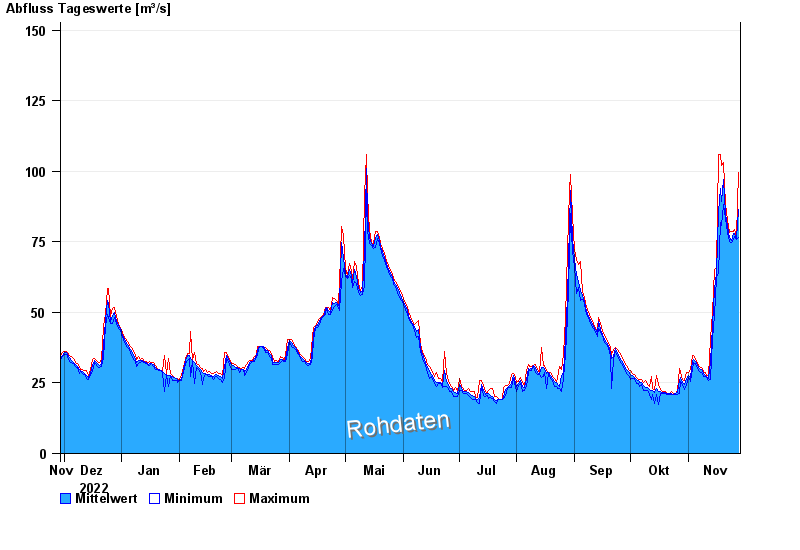
Chart of year Inkofen / Amper
Discharge from 29.11.2022 to 28.11.2023
- 15.04.1994 Abfluss: 249 m³/s
- 01.06.1940 Abfluss: 242 m³/s
- 11.07.1954 Abfluss: 240 m³/s
- 04.06.2013 Abfluss: 238 m³/s
- 13.06.1965 Abfluss: 223 m³/s
| Date | Mean value [m³/s] | Maximum [m³/s] | Minimum [m³/s] |
|---|---|---|---|
| 28.11.2023 | 86.5 | 99.4 | 76.4 |
| 27.11.2023 | 76.3 | 77 | 75.8 |
| 26.11.2023 | 77.8 | 79.4 | 77 |
| 25.11.2023 | 77.9 | 78.8 | 75.8 |
| 24.11.2023 | 75.5 | 78.8 | 74.6 |
| 23.11.2023 | 76.7 | 78.2 | 75.2 |
| 22.11.2023 | 80.5 | 82.5 | 78.2 |
© Bayerisches Landesamt für Umwelt 2024