
- Start >
- Rivers >
- Discharge >
- Obere Donau >
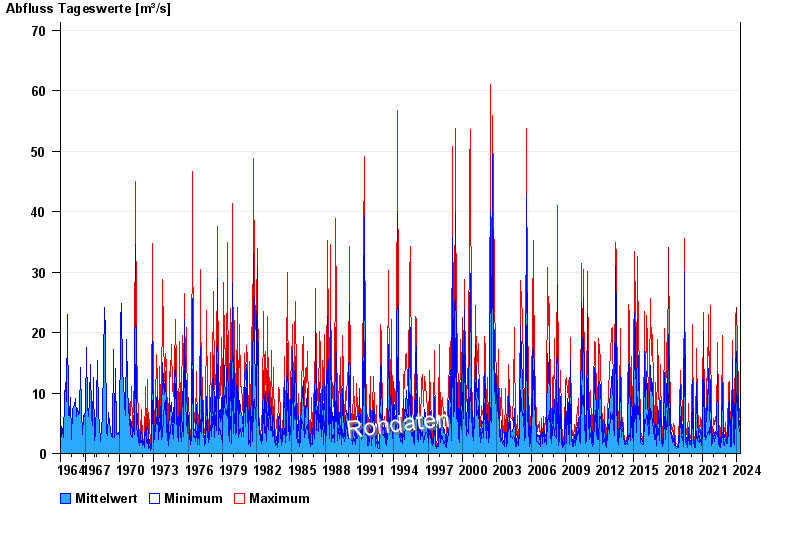
- Hasberg >
- Chart of total period

Chart of total period Hasberg / Mindel
Discharge from 01.11.1964 to 26.04.2024
| Date | Mean value [m³/s] | Maximum [m³/s] | Minimum [m³/s] |
|---|---|---|---|
| 26.04.2024 | 2.46 | 2.54 | 2.42 |
| 25.04.2024 | 2.67 | 2.78 | 2.42 |
| 24.04.2024 | 3.04 | 3.21 | 2.78 |
| 23.04.2024 | 3.4 | 3.82 | 3.07 |
| 22.04.2024 | 4.01 | 4.65 | 3.66 |
| 21.04.2024 | 4.1 | 4.82 | 3.66 |
| 20.04.2024 | 5.81 | 6.94 | 4.31 |
© Bayerisches Landesamt für Umwelt 2024