
- Start >
- Rivers >
- Discharge >
- Obere Donau >
- Hasberg >
- Chart of total period

Chart of total period Hasberg / Mindel
Discharge from 01.11.1964 to 18.04.2024
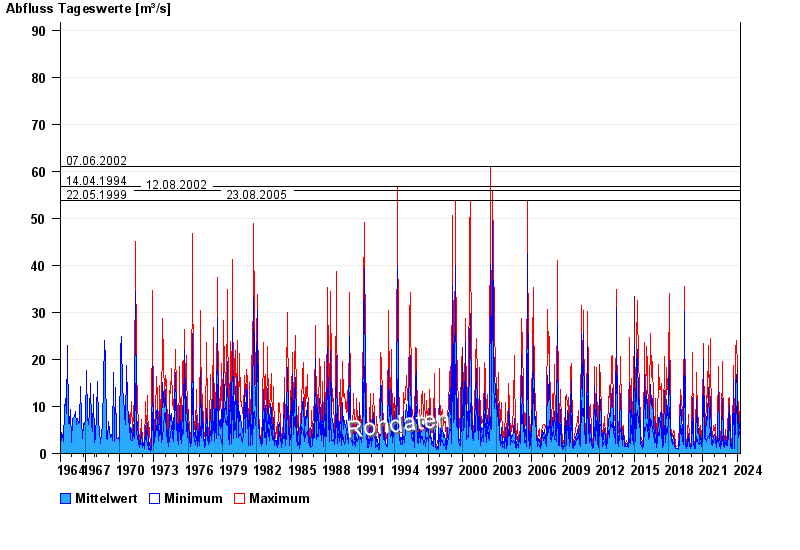
- 07.06.2002 Abfluss: 61 m³/s
- 14.04.1994 Abfluss: 56,8 m³/s
- 12.08.2002 Abfluss: 55,9 m³/s
- 22.05.1999 Abfluss: 53,8 m³/s
- 23.08.2005 Abfluss: 53,7 m³/s
| Date | Mean value [m³/s] | Maximum [m³/s] | Minimum [m³/s] |
|---|---|---|---|
| 18.04.2024 | 3.53 | 3.66 | 3.21 |
| 17.04.2024 | 2.6 | 3.5 | 2.17 |
| 16.04.2024 | 2.43 | 2.66 | 2.17 |
| 15.04.2024 | 2.33 | 3.82 | 1.71 |
| 14.04.2024 | 1.77 | 1.94 | 1.71 |
| 13.04.2024 | 1.78 | 1.83 | 1.71 |
| 12.04.2024 | 1.86 | 1.94 | 1.83 |
© Bayerisches Landesamt für Umwelt 2024