
- Start >
- Rivers >
- Discharge >
- Obere Donau >
- Bockenfeld >
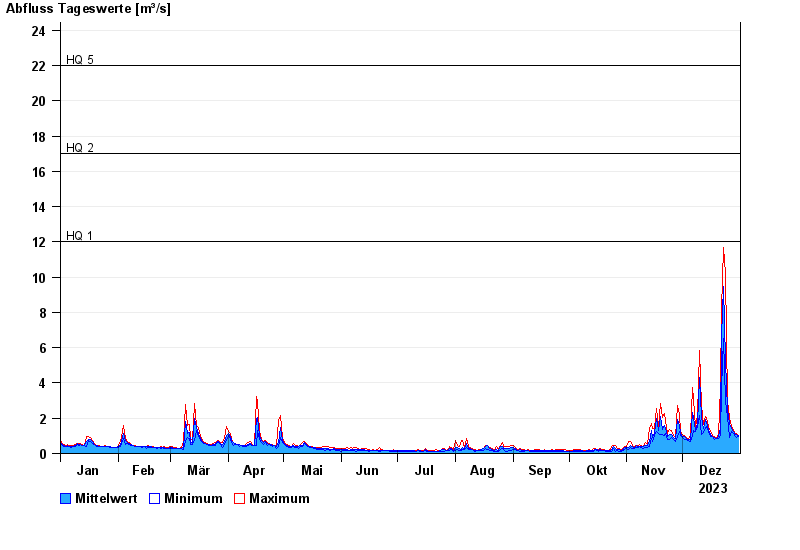
- Chart of year

Chart of year Bockenfeld / Tauber
Discharge from 01.01.2023 to 31.12.2023
note
Wasserstand und Abfluss wird zeitweise durch Biberdamm beeinflusst.
- HQ1 12 m³/s
- HQ2 17 m³/s
- HQ5 22 m³/s
- HQ10 29 m³/s
- HQ20 35 m³/s
- HQ50 44 m³/s
- HQ100 54 m³/s
| Date | Mean value [m³/s] | Maximum [m³/s] | Minimum [m³/s] |
|---|---|---|---|
| 31.12.2023 | 1.01 | 1.03 | 0.976 |
| 30.12.2023 | 1.06 | 1.11 | 0.904 |
| 29.12.2023 | 1.14 | 1.2 | 1.03 |
| 28.12.2023 | 1.24 | 1.36 | 1.16 |
| 27.12.2023 | 1.41 | 1.55 | 1.26 |
| 26.12.2023 | 1.72 | 2.06 | 0.909 |
| 25.12.2023 | 2.48 | 3.03 | 2.06 |
© Bayerisches Landesamt für Umwelt 2024