
- Start >
- Rivers >
- Discharge >
- Obere Donau >
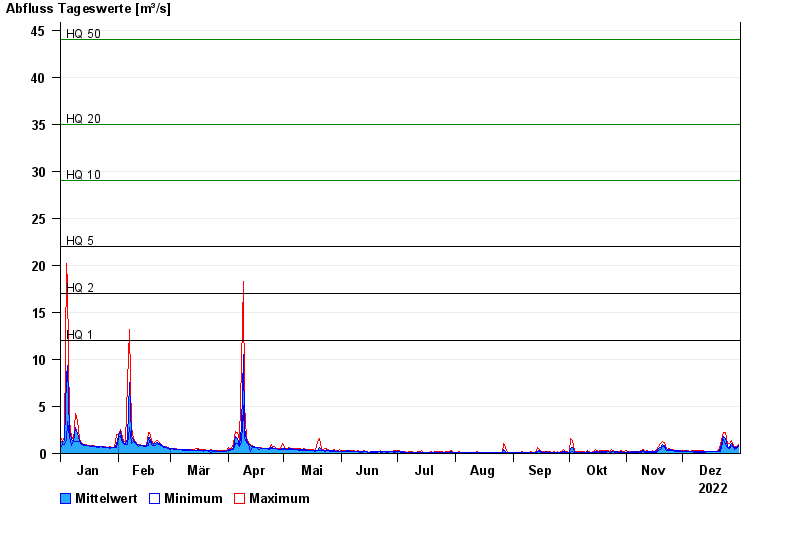
- Bockenfeld >
- Chart of year

Chart of year Bockenfeld / Tauber
Discharge from 01.01.2022 to 31.12.2022
note
Wasserstand und Abfluss wird zeitweise durch Biberdamm beeinflusst.
- HQ1 12 m³/s
- HQ2 17 m³/s
- HQ5 22 m³/s
- HQ10 29 m³/s
- HQ20 35 m³/s
- HQ50 44 m³/s
- HQ100 54 m³/s
| Date | Mean value [m³/s] | Maximum [m³/s] | Minimum [m³/s] |
|---|---|---|---|
| 31.12.2022 | 0.853 | 0.929 | 0.739 |
| 30.12.2022 | 0.681 | 0.765 | 0.543 |
| 29.12.2022 | 0.556 | 0.61 | 0.469 |
| 28.12.2022 | 0.692 | 0.82 | 0.607 |
| 27.12.2022 | 1.1 | 1.33 | 0.82 |
| 26.12.2022 | 0.682 | 1.1 | 0.484 |
| 25.12.2022 | 0.741 | 0.991 | 0.593 |
© Bayerisches Landesamt für Umwelt 2024