
- Start >
- Rivers >
- Discharge >
- Obere Donau >
- Amberg >
- Chart of year

Chart of year Amberg / Vils
Discharge from 01.01.2024 to 27.04.2024
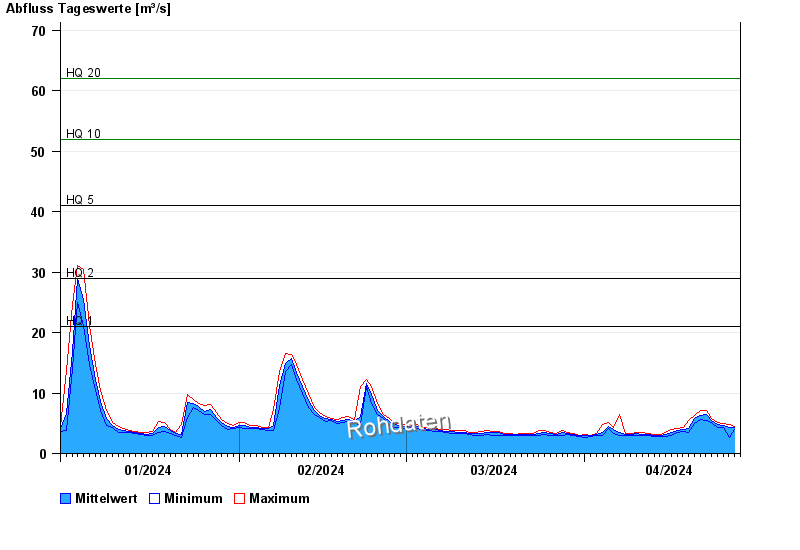
- HQ1 21 m³/s
- HQ2 29 m³/s
- HQ5 41 m³/s
- HQ10 52 m³/s
- HQ20 62 m³/s
- HQ50 80 m³/s
- HQ100 93 m³/s
| Date | Mean value [m³/s] | Maximum [m³/s] | Minimum [m³/s] |
|---|---|---|---|
| 27.04.2024 | 4.19 | 4.38 | 3.91 |
| 26.04.2024 | 4.25 | 4.72 | 2.53 |
| 25.04.2024 | 4.65 | 4.88 | 4.38 |
| 24.04.2024 | 4.82 | 5.06 | 4.38 |
| 23.04.2024 | 5.52 | 5.77 | 5.06 |
| 22.04.2024 | 6.42 | 7.09 | 5.4 |
| 21.04.2024 | 6.25 | 7.09 | 5.58 |
© Bayerisches Landesamt für Umwelt 2024