
- Start >
- Rivers >
- Discharge >
- Obere Donau >
- Amberg >
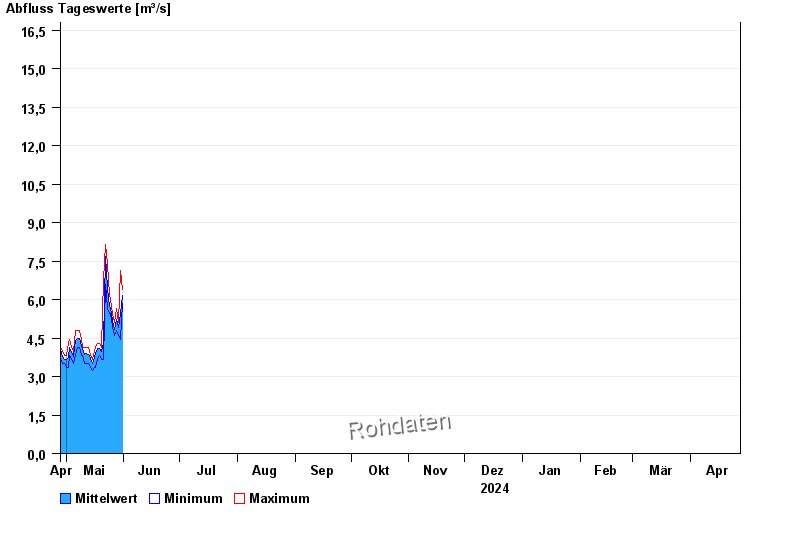
- Chart of year

Chart of year Amberg / Vils
Discharge from 28.04.2024 to 27.04.2025
- HQ1 21 m³/s
- HQ2 29 m³/s
- HQ5 41 m³/s
- HQ10 52 m³/s
- HQ20 62 m³/s
- HQ50 80 m³/s
- HQ100 93 m³/s
| Date | Mean value [m³/s] | Maximum [m³/s] | Minimum [m³/s] |
|---|---|---|---|
| 09.05.2024 | 4.24 | 4.28 | 3.97 |
| 08.05.2024 | 4.49 | 4.78 | 4.13 |
| 07.05.2024 | 4.5 | 4.78 | 4.13 |
| 06.05.2024 | 4.42 | 4.78 | 3.82 |
| 05.05.2024 | 3.8 | 3.97 | 3.52 |
| 04.05.2024 | 3.92 | 4.13 | 3.67 |
| 03.05.2024 | 4.12 | 4.44 | 3.82 |
© Bayerisches Landesamt für Umwelt 2024