
- Start >
- Rivers >
- Discharge >
- Obere Donau >
- Aha >
- Chart of total period

Chart of total period Aha / Altmühl
Discharge from 01.11.1975 to 27.04.2024
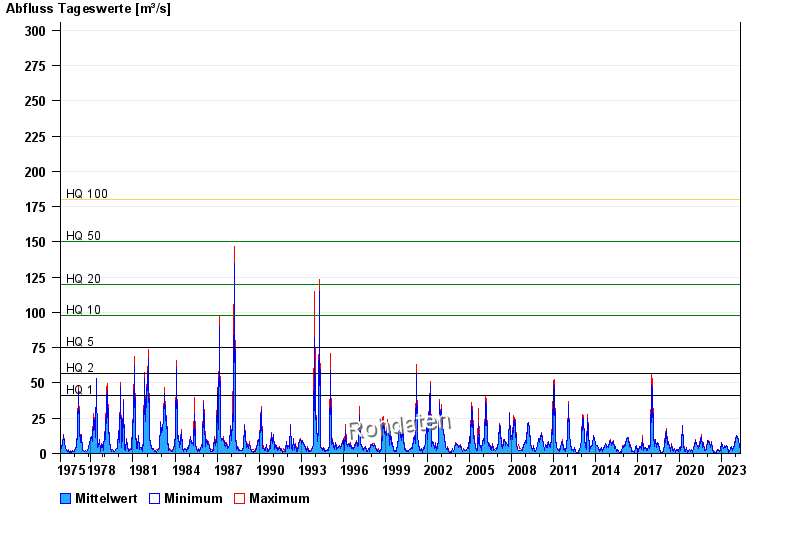
- HQ1 41 m³/s
- HQ2 57 m³/s
- HQ5 75 m³/s
- HQ10 98 m³/s
- HQ20 120 m³/s
- HQ50 150 m³/s
- HQ100 180 m³/s
| Date | Mean value [m³/s] | Maximum [m³/s] | Minimum [m³/s] |
|---|---|---|---|
| 27.04.2024 | 1.92 | 1.95 | 1.91 |
| 26.04.2024 | 1.67 | 1.91 | 1.56 |
| 25.04.2024 | 2.6 | 2.98 | 1.71 |
| 24.04.2024 | 3.05 | 3.08 | 2.98 |
| 23.04.2024 | 3.01 | 3.08 | 2.93 |
| 22.04.2024 | 2.81 | 2.93 | 2.7 |
| 21.04.2024 | 2.5 | 2.7 | 2.3 |
© Bayerisches Landesamt für Umwelt 2024