
- Start >
- Rivers >
- Discharge >
- Obere Donau >
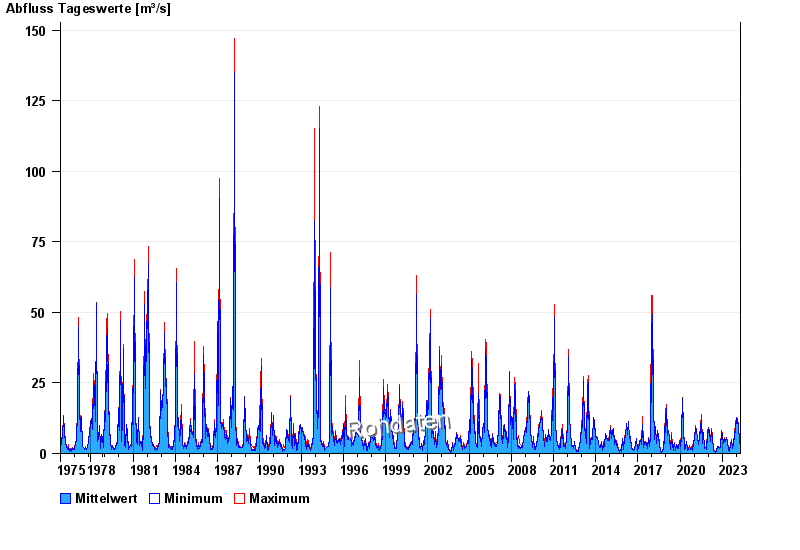
- Aha >
- Chart of total period

Chart of total period Aha / Altmühl
Discharge from 01.11.1975 to 23.04.2024
| Date | Mean value [m³/s] | Maximum [m³/s] | Minimum [m³/s] |
|---|---|---|---|
| 23.04.2024 | 2.95 | 2.98 | 2.93 |
| 22.04.2024 | 2.81 | 2.93 | 2.7 |
| 21.04.2024 | 2.5 | 2.7 | 2.3 |
| 20.04.2024 | 2.26 | 2.3 | 2.21 |
| 19.04.2024 | 2.06 | 2.26 | 1.95 |
| 18.04.2024 | 1.92 | 2 | 1.83 |
| 17.04.2024 | 1.72 | 1.83 | 1.64 |
© Bayerisches Landesamt für Umwelt 2024