

Chart of year Weg / Isen
Discharge from 12.05.2022 to 11.05.2023
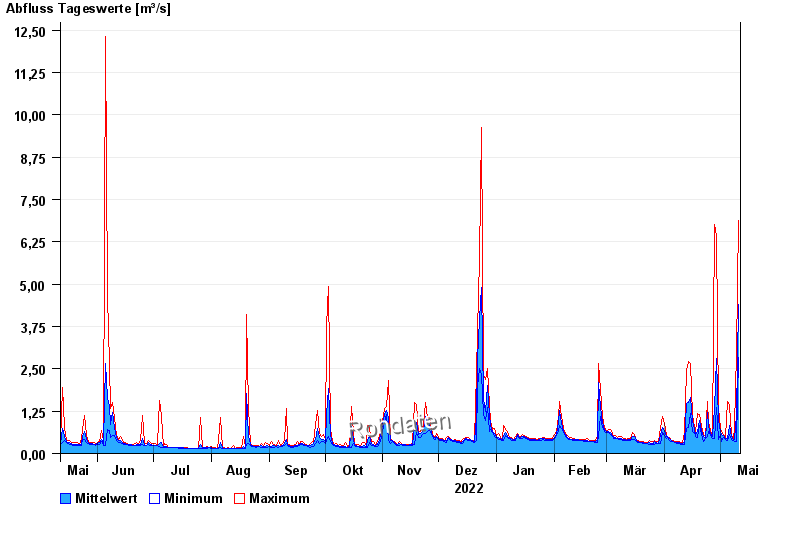
| Date | Mean value [m³/s] | Maximum [m³/s] | Minimum [m³/s] |
|---|---|---|---|
| 11.05.2023 | 4.4 | 6.89 | 2.84 |
| 10.05.2023 | 1.13 | 2.99 | 0.362 |
| 09.05.2023 | 0.405 | 0.811 | 0.362 |
| 08.05.2023 | 0.401 | 0.42 | 0.379 |
| 07.05.2023 | 0.49 | 0.574 | 0.42 |
| 06.05.2023 | 0.827 | 1.42 | 0.574 |
| 05.05.2023 | 0.455 | 1.54 | 0.379 |
© Bayerisches Landesamt für Umwelt 2024