

Chart of year Weg / Isen
Discharge from 12.05.2021 to 11.05.2022
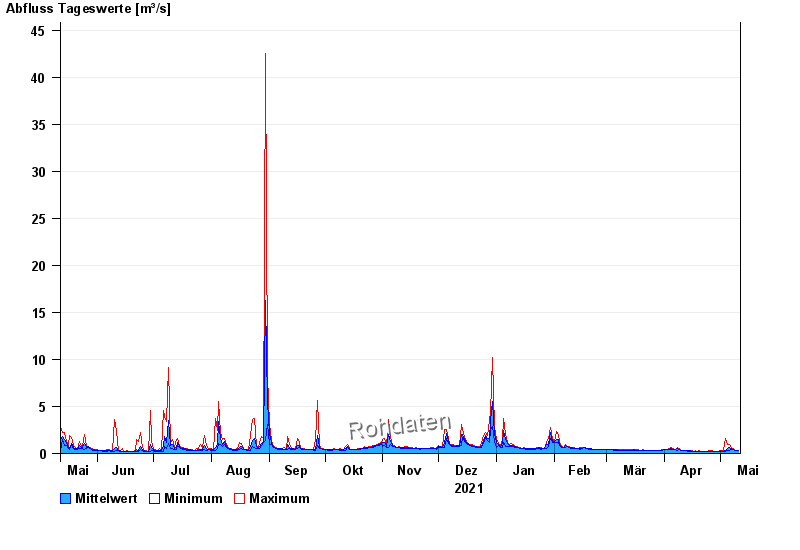
| Date | Mean value [m³/s] | Maximum [m³/s] | Minimum [m³/s] |
|---|---|---|---|
| 11.05.2022 | 0.304 | 0.333 | 0.277 |
| 10.05.2022 | 0.327 | 0.351 | 0.314 |
| 09.05.2022 | 0.365 | 0.388 | 0.295 |
| 08.05.2022 | 0.441 | 0.5 | 0.388 |
| 07.05.2022 | 0.502 | 0.531 | 0.449 |
| 06.05.2022 | 0.676 | 1 | 0.333 |
| 05.05.2022 | 0.488 | 1 | 0.351 |
© Bayerisches Landesamt für Umwelt 2024