

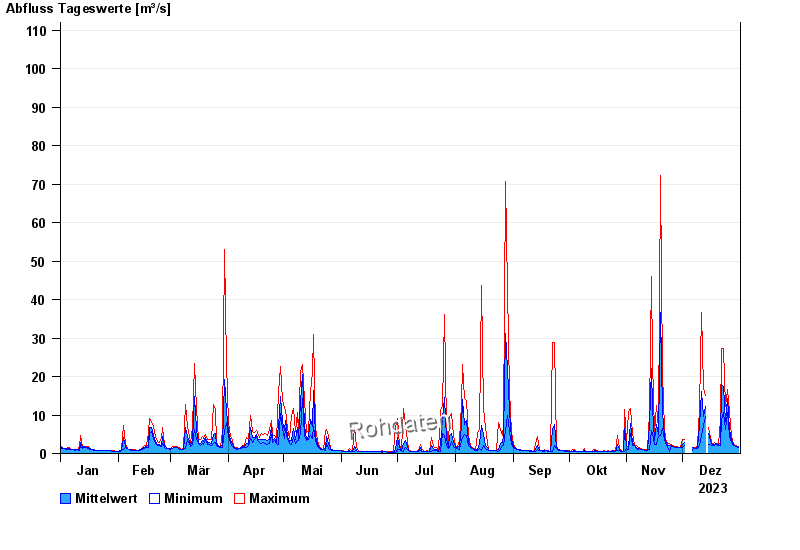
Chart of year Walchen / Walchen
Discharge from 01.01.2023 to 31.12.2023
- 23.08.2005 Abfluss: 210 m³/s
- 22.05.1999 Abfluss: 199 m³/s
- 03.06.2010 Abfluss: 150 m³/s
- 12.08.2002 Abfluss: 147 m³/s
- 22.12.1991 Abfluss: 143 m³/s
| Date | Mean value [m³/s] | Maximum [m³/s] | Minimum [m³/s] |
|---|---|---|---|
| 31.12.2023 | 1.78 | 1.86 | 1.62 |
| 30.12.2023 | 1.92 | 1.98 | 1.86 |
| 29.12.2023 | 2.04 | 2.12 | 1.98 |
| 28.12.2023 | 2.34 | 2.58 | 2.12 |
| 27.12.2023 | 3.46 | 4.38 | 2.75 |
| 26.12.2023 | 6.13 | 11 | 4.38 |
| 25.12.2023 | 14.2 | 16.6 | 10.7 |
© Bayerisches Landesamt für Umwelt 2024