

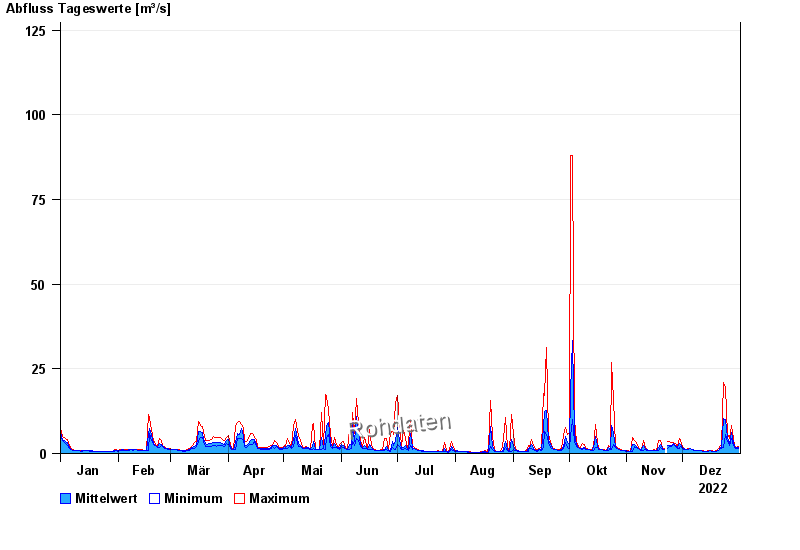
Chart of year Walchen / Walchen
Discharge from 01.01.2022 to 31.12.2022
- 23.08.2005 Abfluss: 210 m³/s
- 22.05.1999 Abfluss: 199 m³/s
- 03.06.2010 Abfluss: 150 m³/s
- 12.08.2002 Abfluss: 147 m³/s
- 22.12.1991 Abfluss: 143 m³/s
| Date | Mean value [m³/s] | Maximum [m³/s] | Minimum [m³/s] |
|---|---|---|---|
| 31.12.2022 | 1.78 | 2.1 | 1.5 |
| 30.12.2022 | 1.64 | 1.84 | 1.5 |
| 29.12.2022 | 2.08 | 2.4 | 1.84 |
| 28.12.2022 | 3.23 | 4.57 | 2.4 |
| 27.12.2022 | 6.26 | 8.4 | 4.34 |
| 26.12.2022 | 3.06 | 4.34 | 2.4 |
| 25.12.2022 | 4.79 | 5.56 | 3.69 |
© Bayerisches Landesamt für Umwelt 2024