
- Start >
- Rivers >
- Discharge >
- Isar >
- Teisendorf >
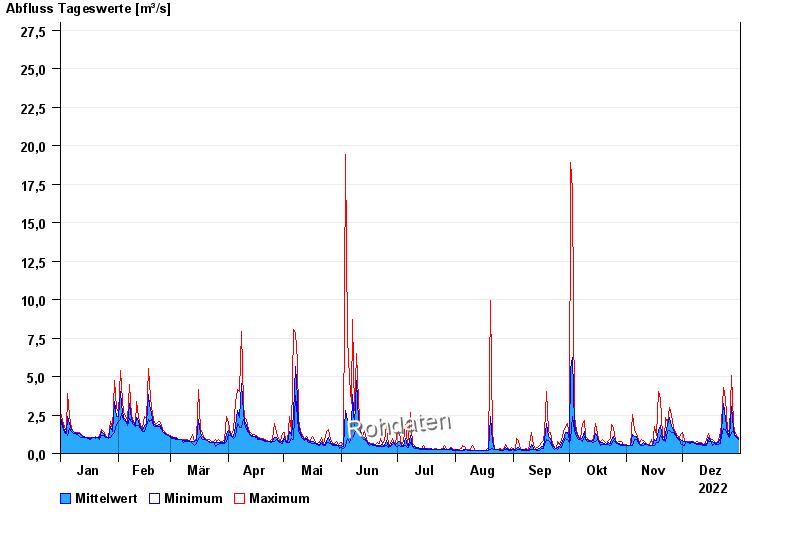
- Chart of year

Chart of year Teisendorf / Sur
Discharge from 01.01.2022 to 31.12.2022
- 04.08.2020 Abfluss: 92 m³/s
- 12.08.2002 Abfluss: 79,6 m³/s
- 02.06.2013 Abfluss: 57,8 m³/s
- 26.06.1995 Abfluss: 53,8 m³/s
- 12.06.1971 Abfluss: 53 m³/s
| Date | Mean value [m³/s] | Maximum [m³/s] | Minimum [m³/s] |
|---|---|---|---|
| 31.12.2022 | 0.987 | 1.05 | 0.941 |
| 30.12.2022 | 1.09 | 1.16 | 1.05 |
| 29.12.2022 | 1.25 | 1.4 | 1.16 |
| 28.12.2022 | 1.61 | 2.04 | 1.4 |
| 27.12.2022 | 3.04 | 5.07 | 1.34 |
| 26.12.2022 | 1.13 | 1.34 | 1.05 |
| 25.12.2022 | 1.35 | 1.54 | 1.21 |
© Bayerisches Landesamt für Umwelt 2024