
- Start >
- Rivers >
- Discharge >
- Isar >
- Teisendorf >
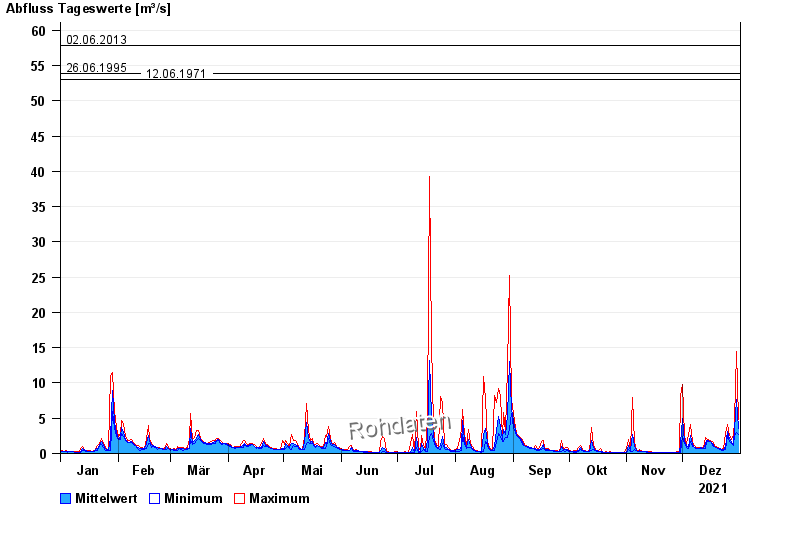
- Chart of year

Chart of year Teisendorf / Sur
Discharge from 01.01.2021 to 31.12.2021
- 04.08.2020 Abfluss: 92 m³/s
- 12.08.2002 Abfluss: 79,6 m³/s
- 02.06.2013 Abfluss: 57,8 m³/s
- 26.06.1995 Abfluss: 53,8 m³/s
- 12.06.1971 Abfluss: 53 m³/s
| Date | Mean value [m³/s] | Maximum [m³/s] | Minimum [m³/s] |
|---|---|---|---|
| 31.12.2021 | 3.5 | 4.77 | 2.69 |
| 30.12.2021 | 7.67 | 14.4 | 2.92 |
| 29.12.2021 | 3.35 | 4.64 | 2.58 |
| 28.12.2021 | 1.46 | 2.58 | 1.18 |
| 27.12.2021 | 1.59 | 1.94 | 1.36 |
| 26.12.2021 | 2.07 | 2.58 | 1.74 |
| 25.12.2021 | 3.14 | 4.14 | 2.58 |
© Bayerisches Landesamt für Umwelt 2024