

Chart of year Raisting / Rott
Discharge from 20.08.2020 to 19.08.2021
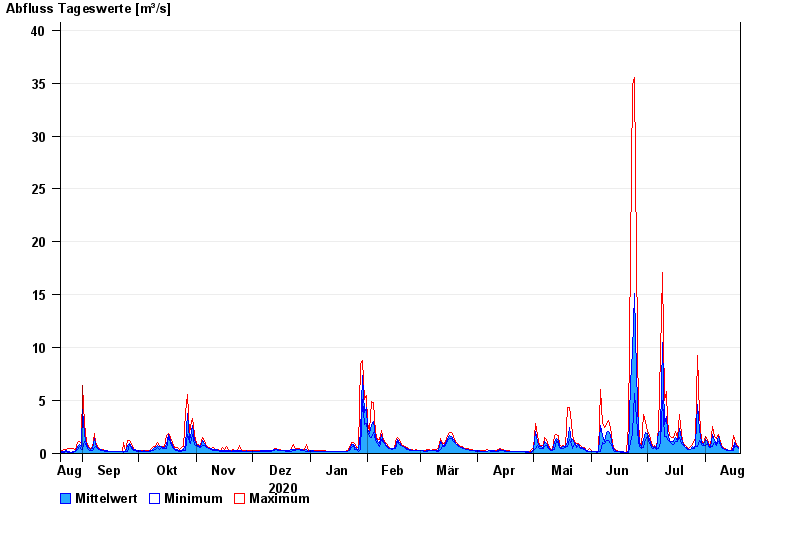
| Date | Mean value [m³/s] | Maximum [m³/s] | Minimum [m³/s] |
|---|---|---|---|
| 19.08.2021 | 0.547 | 0.625 | 0.479 |
| 18.08.2021 | 0.763 | 0.85 | 0.625 |
| 17.08.2021 | 1.03 | 1.44 | 0.734 |
| 16.08.2021 | 0.595 | 1.74 | 0.285 |
| 15.08.2021 | 0.316 | 0.318 | 0.284 |
| 14.08.2021 | 0.318 | 0.318 | 0.318 |
| 13.08.2021 | 0.354 | 0.354 | 0.318 |
© Bayerisches Landesamt für Umwelt 2024