

Chart of year Raisting / Rott
Discharge from 20.08.2019 to 19.08.2020
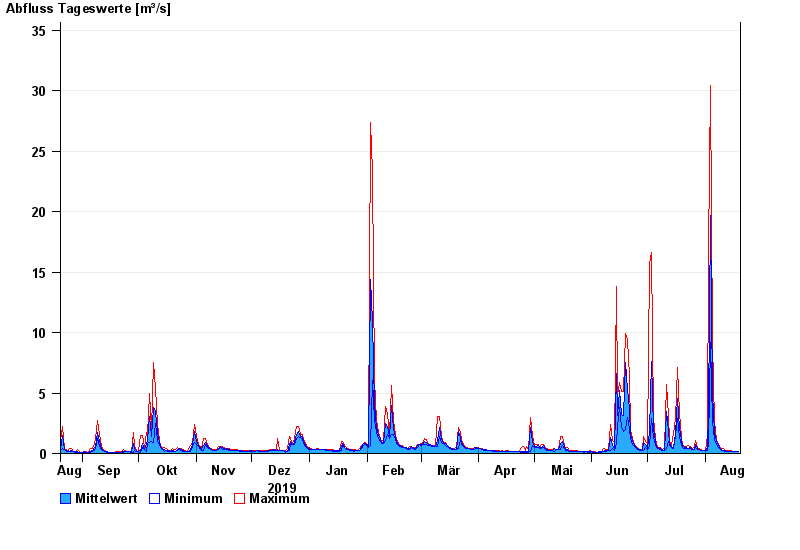
| Date | Mean value [m³/s] | Maximum [m³/s] | Minimum [m³/s] |
|---|---|---|---|
| 19.08.2020 | 0.155 | 0.164 | 0.145 |
| 18.08.2020 | 0.145 | 0.145 | 0.145 |
| 17.08.2020 | 0.162 | 0.186 | 0.145 |
| 16.08.2020 | 0.185 | 0.187 | 0.165 |
| 15.08.2020 | 0.2 | 0.211 | 0.187 |
| 14.08.2020 | 0.18 | 0.211 | 0.165 |
| 13.08.2020 | 0.196 | 0.211 | 0.187 |
© Bayerisches Landesamt für Umwelt 2024