

Chart of total period Plattling / Isar
Discharge from 01.11.1925 to 26.04.2024
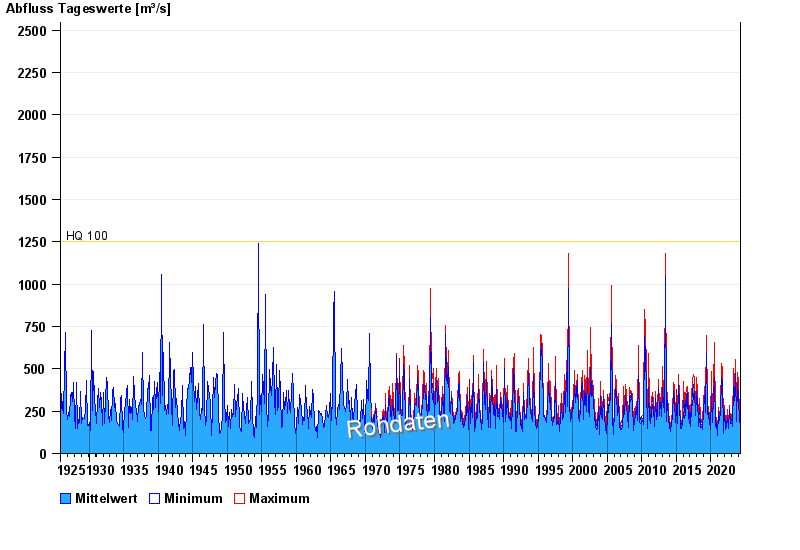
- HQ100 1250 m³/s
| Date | Mean value [m³/s] | Maximum [m³/s] | Minimum [m³/s] |
|---|---|---|---|
| 26.04.2024 | 168 | 187 | 156 |
| 25.04.2024 | 180 | 191 | 170 |
| 24.04.2024 | 187 | 194 | 177 |
| 23.04.2024 | 178 | 196 | 163 |
| 22.04.2024 | 179 | 198 | 163 |
| 21.04.2024 | 159 | 170 | 149 |
| 20.04.2024 | 162 | 170 | 156 |
© Bayerisches Landesamt für Umwelt 2024