

Chart of total period Plattling / Isar
Discharge from 01.11.1925 to 18.04.2024
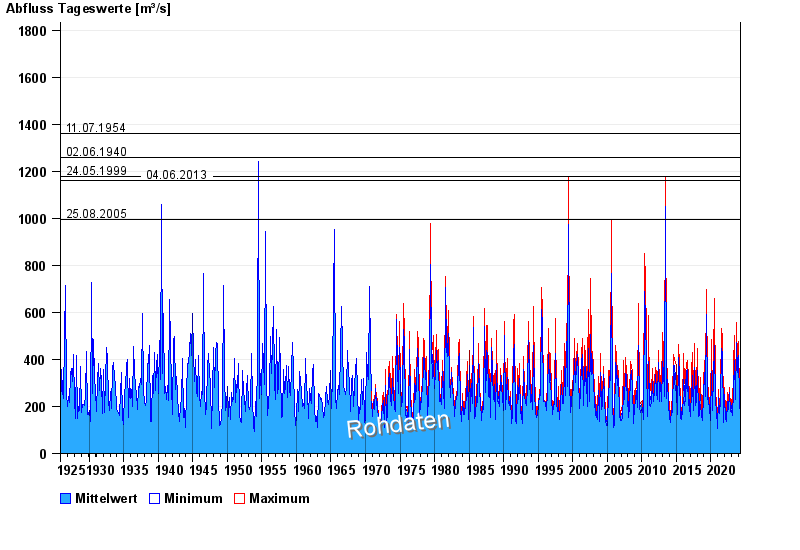
- 11.07.1954 Abfluss: 1360 m³/s
- 02.06.1940 Abfluss: 1260 m³/s
- 24.05.1999 Abfluss: 1180 m³/s
- 04.06.2013 Abfluss: 1160 m³/s
- 25.08.2005 Abfluss: 995 m³/s
| Date | Mean value [m³/s] | Maximum [m³/s] | Minimum [m³/s] |
|---|---|---|---|
| 18.04.2024 | 147 | 156 | 139 |
| 17.04.2024 | 138 | 147 | 126 |
| 16.04.2024 | 139 | 158 | 130 |
| 15.04.2024 | 130 | 135 | 121 |
| 14.04.2024 | 120 | 135 | 111 |
| 13.04.2024 | 117 | 130 | 104 |
| 12.04.2024 | 136 | 149 | 121 |
© Bayerisches Landesamt für Umwelt 2024