

Chart of year Percha / Lüßbach
Discharge from 18.11.2020 to 17.11.2021
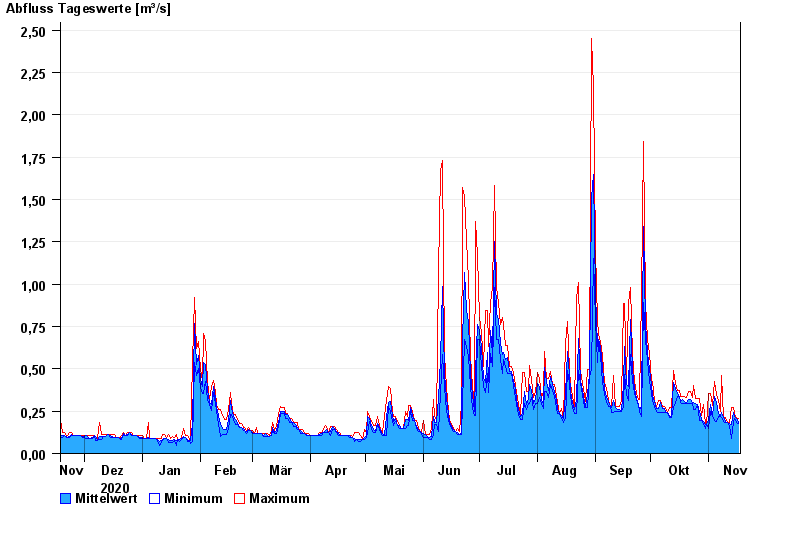
| Date | Mean value [m³/s] | Maximum [m³/s] | Minimum [m³/s] |
|---|---|---|---|
| 17.11.2021 | 0.182 | 0.208 | 0.18 |
| 16.11.2021 | 0.204 | 0.209 | 0.181 |
| 15.11.2021 | 0.216 | 0.239 | 0.209 |
| 14.11.2021 | 0.24 | 0.272 | 0.183 |
| 13.11.2021 | 0.173 | 0.272 | 0.091 |
| 12.11.2021 | 0.175 | 0.185 | 0.16 |
| 11.11.2021 | 0.186 | 0.186 | 0.185 |
© Bayerisches Landesamt für Umwelt 2024