

Chart of year Percha / Lüßbach
Discharge from 18.11.2019 to 17.11.2020
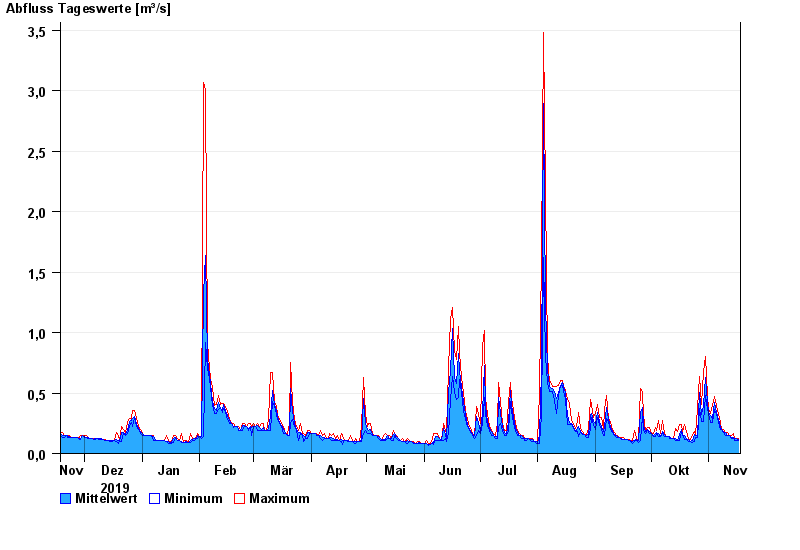
| Date | Mean value [m³/s] | Maximum [m³/s] | Minimum [m³/s] |
|---|---|---|---|
| 17.11.2020 | 0.114 | 0.126 | 0.109 |
| 16.11.2020 | 0.121 | 0.126 | 0.11 |
| 15.11.2020 | 0.124 | 0.127 | 0.11 |
| 14.11.2020 | 0.131 | 0.169 | 0.127 |
| 13.11.2020 | 0.134 | 0.147 | 0.127 |
| 12.11.2020 | 0.147 | 0.147 | 0.147 |
| 11.11.2020 | 0.148 | 0.17 | 0.147 |
© Bayerisches Landesamt für Umwelt 2024