

Chart of total period Operding / Hammerbach
Discharge from 01.11.1967 to 08.12.2025
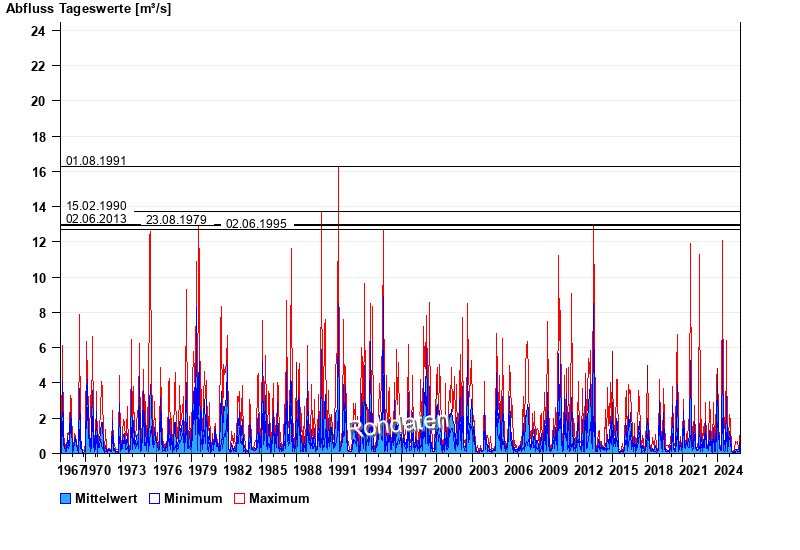
- 01.08.1991 Abfluss: 16,3 m³/s
- 15.02.1990 Abfluss: 13,7 m³/s
- 02.06.2013 Abfluss: 13 m³/s
- 23.08.1979 Abfluss: 12,9 m³/s
- 02.06.1995 Abfluss: 12,7 m³/s
| Date | Mean value [m³/s] | Maximum [m³/s] | Minimum [m³/s] |
|---|---|---|---|
| 08.12.2025 | 1.08 | 1.59 | 0.153 |
| 07.12.2025 | 0.077 | 0.153 | 0.061 |
| 06.12.2025 | 0.071 | 0.072 | 0.061 |
| 05.12.2025 | 0.073 | 0.085 | 0.072 |
| 04.12.2025 | 0.085 | 0.085 | 0.085 |
| 03.12.2025 | 0.095 | 0.1 | 0.085 |
| 02.12.2025 | 0.108 | 0.116 | 0.1 |
© Bayerisches Landesamt für Umwelt 2025