

Chart of total period Operding / Hammerbach
Discharge from 01.11.1967 to 25.04.2024
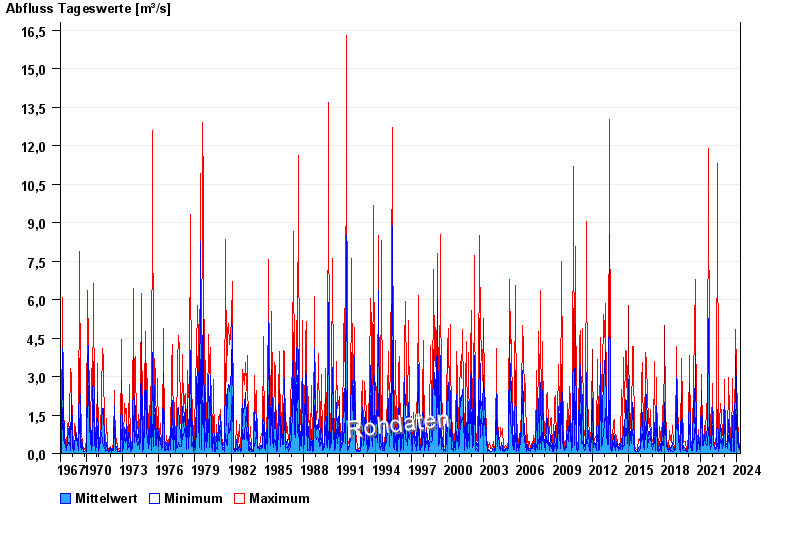
| Date | Mean value [m³/s] | Maximum [m³/s] | Minimum [m³/s] |
|---|---|---|---|
| 25.04.2024 | 0.127 | 0.132 | 0.115 |
| 24.04.2024 | 0.132 | 0.132 | 0.132 |
| 23.04.2024 | 0.16 | 0.173 | 0.132 |
| 22.04.2024 | 0.215 | 0.244 | 0.173 |
| 21.04.2024 | 0.154 | 0.27 | 0.115 |
| 20.04.2024 | 0.115 | 0.115 | 0.115 |
| 19.04.2024 | 0.114 | 0.132 | 0.099 |
© Bayerisches Landesamt für Umwelt 2024