

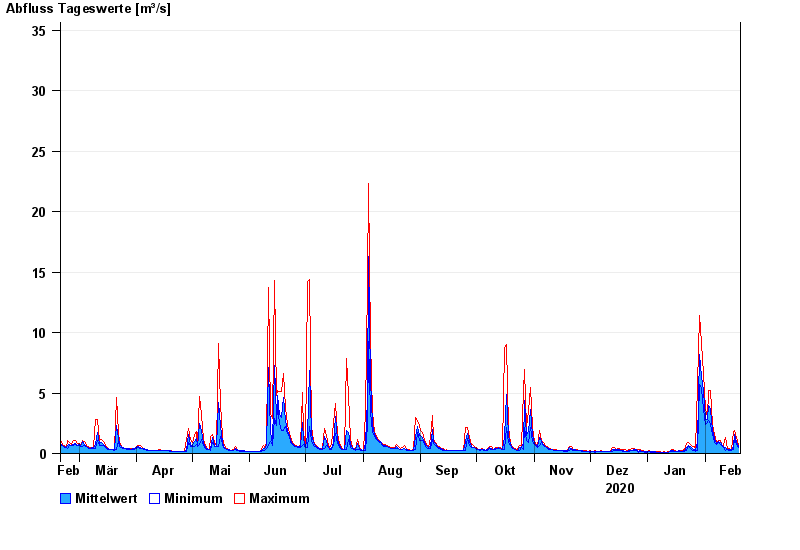
Chart of year Obernach / Ach
Discharge from 20.02.2020 to 19.02.2021
- 22.05.1999 Abfluss: 85,5 m³/s
- 31.07.1990 Abfluss: 62,9 m³/s
- 03.02.1970 Abfluss: 59 m³/s
- 31.07.1990 Abfluss: 54,4 m³/s
- 15.01.1968 Abfluss: 54,3 m³/s
| Date | Mean value [m³/s] | Maximum [m³/s] | Minimum [m³/s] |
|---|---|---|---|
| 19.02.2021 | 0.543 | 0.754 | 0.489 |
| 18.02.2021 | 0.962 | 1.33 | 0.754 |
| 17.02.2021 | 1.59 | 1.94 | 1.33 |
| 16.02.2021 | 0.604 | 1.86 | 0.322 |
| 15.02.2021 | 0.296 | 0.357 | 0.232 |
| 14.02.2021 | 0.325 | 0.435 | 0.208 |
| 13.02.2021 | 0.37 | 0.435 | 0.32 |
© Bayerisches Landesamt für Umwelt 2024