

Chart of year Obernach / Ach
Discharge from 20.02.2020 to 19.02.2021
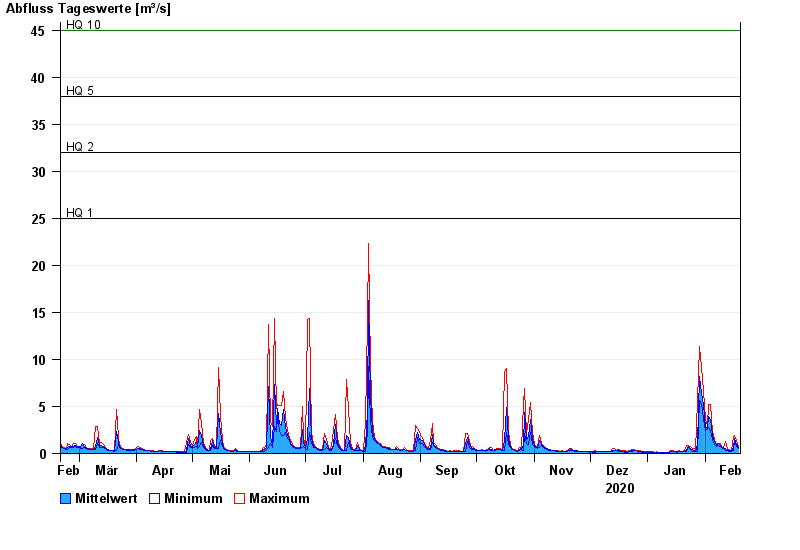
- HQ1 25 m³/s
- HQ2 32 m³/s
- HQ5 38 m³/s
- HQ10 45 m³/s
- HQ20 52 m³/s
- HQ50 63 m³/s
- HQ100 70 m³/s
| Date | Mean value [m³/s] | Maximum [m³/s] | Minimum [m³/s] |
|---|---|---|---|
| 19.02.2021 | 0.543 | 0.754 | 0.489 |
| 18.02.2021 | 0.962 | 1.33 | 0.754 |
| 17.02.2021 | 1.59 | 1.94 | 1.33 |
| 16.02.2021 | 0.604 | 1.86 | 0.322 |
| 15.02.2021 | 0.296 | 0.357 | 0.232 |
| 14.02.2021 | 0.325 | 0.435 | 0.208 |
| 13.02.2021 | 0.37 | 0.435 | 0.32 |
© Bayerisches Landesamt für Umwelt 2024