
- Start >
- Rivers >
- Discharge >
- Isar >
- Obermühlhausen >
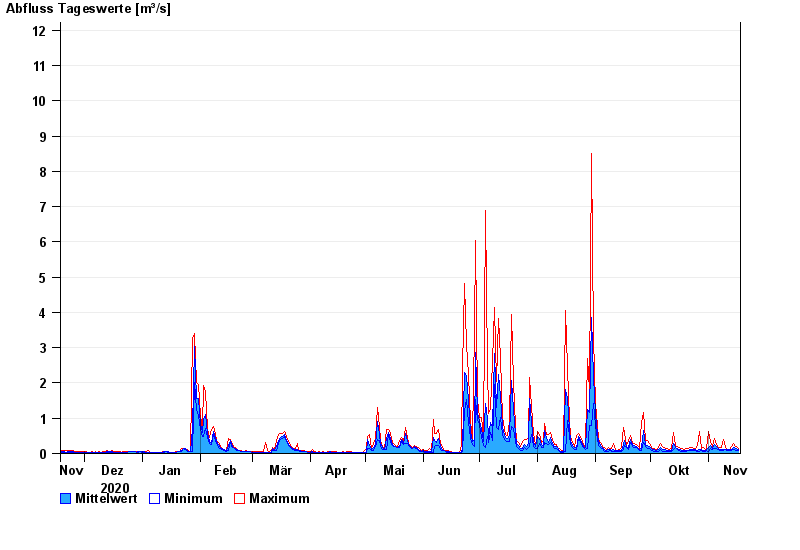
- Chart of year

Chart of year Obermühlhausen / Windach
Discharge from 18.11.2020 to 17.11.2021
- 21.05.1999 Abfluss: 25,6 m³/s
- 06.08.2000 Abfluss: 21,3 m³/s
- 02.06.2013 Abfluss: 18,8 m³/s
- 18.06.1979 Abfluss: 18,7 m³/s
- 13.04.1994 Abfluss: 16,3 m³/s
| Date | Mean value [m³/s] | Maximum [m³/s] | Minimum [m³/s] |
|---|---|---|---|
| 17.11.2021 | 0.126 | 0.154 | 0.099 |
| 16.11.2021 | 0.141 | 0.186 | 0.099 |
| 15.11.2021 | 0.161 | 0.221 | 0.126 |
| 14.11.2021 | 0.159 | 0.297 | 0.126 |
| 13.11.2021 | 0.114 | 0.187 | 0.077 |
| 12.11.2021 | 0.1 | 0.127 | 0.077 |
| 11.11.2021 | 0.102 | 0.127 | 0.078 |
© Bayerisches Landesamt für Umwelt 2024